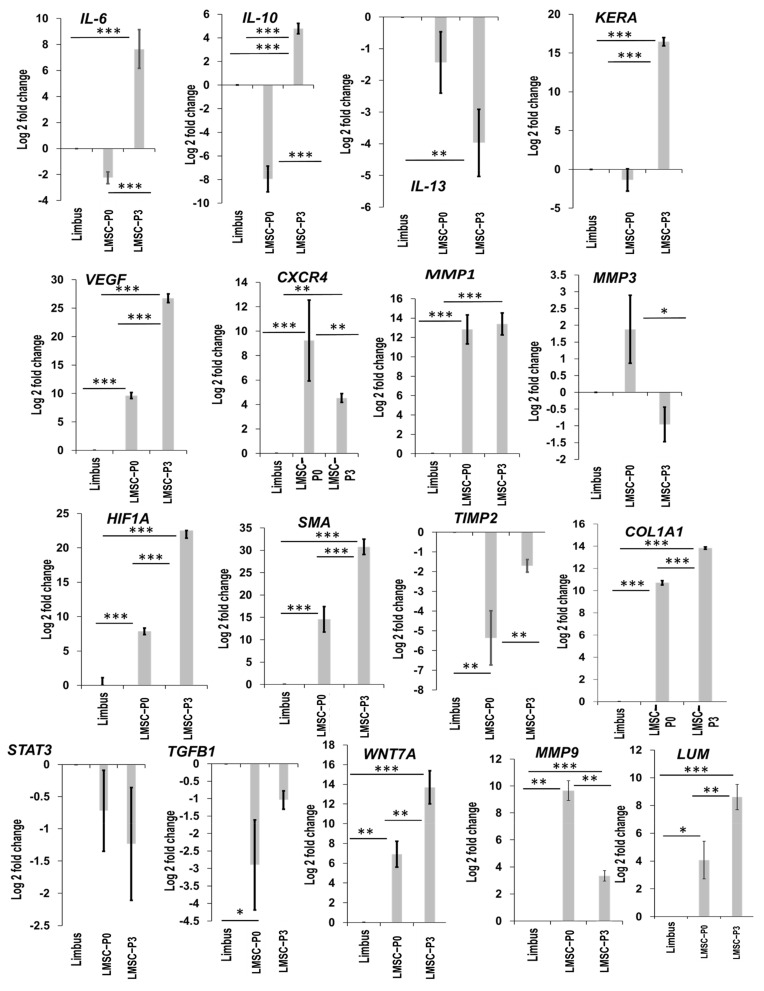
Figure 7.
Validating the levels of DEGs. Level of expression of the differentially expressed genes validated through qRT-PCR. The levels of DEGs in limbal epithelial (LMSC−P0) and stromal (LMSC−P3) cells was quantified relative to native limbal tissue (n = 5). The results were plotted as mean log 2-fold change ± SD. The statistical analysis was performed using Kruskal–Wallis one-way ANOVA test. * p < 0.05, ** p < 0.01, *** p < 0.001.

