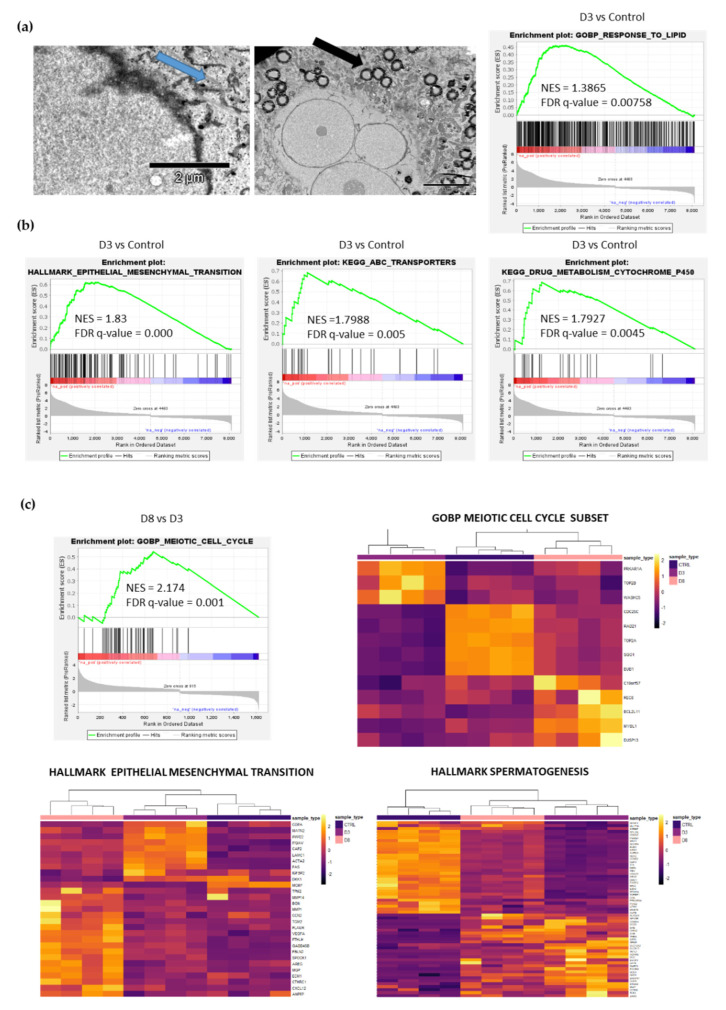
Figure 4.
Transcriptome changes during escape from TIS. (a) Representative images of glycogen (left panel, blue arrow) and lipid droplets (right panel, black arrow) of IRI-treated senescence MCF-7 cells. Pictures were taken with the use of transmission electron microscope. GSEA analysis of the MCF-7 cells transcriptome on D3 compared to control after IRI. Positive enrichment in the indicated GOBP (gene ontology biological processes) pathway is shown. (b) GSEA analysis of the MCF-7 cells transcriptome on D3 compared to control after IRI treatment. Positive enrichment in indicated KEGG and HALLMARK pathways is shown. (c) GSEA analysis of the MCF-7 cells transcriptome on D8 compared to D3 after IRI treatment. Positive enrichment in the indicated GO pathway is shown. Heatmaps representing GOBP Meiotic Cell Cycle, HALLMARK EPITHELIAL MESENCHYMAL TRANSITION and HALLMARK SPERMATOGENESIS were prepared on differentially expressed genes from the respective gene set.

