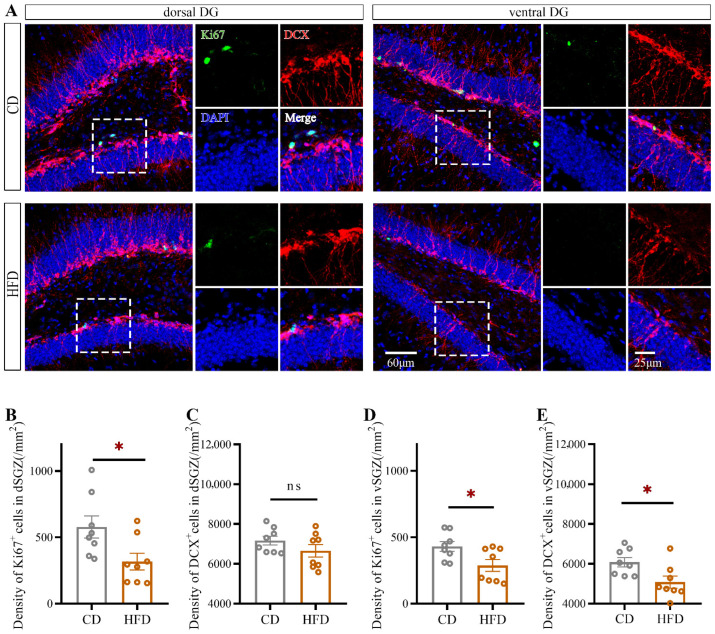
Figure 3.
Effect of HFD consumption in adolescence on DCX and Ki67 expression in the mouse hippocampus. (A) Fluorescence staining of DCX+ and Ki67+ cells in the dorsal and ventral hippocampus of CD- and HFD-fed mice. Green, red and blue fluorescence represent Ki67, DCX, and DAPI, respectively. The numbers of Ki67+ and DCX+ cells in the dSGZ (B,C) and vSGZ (D,E) were counted. The data are expressed as the mean ± SEM (n = 8 mice per group). When the HFD group was compared with the CD group, the data were analyzed using Student’s t-test. ns, not significant; * p < 0.05.

