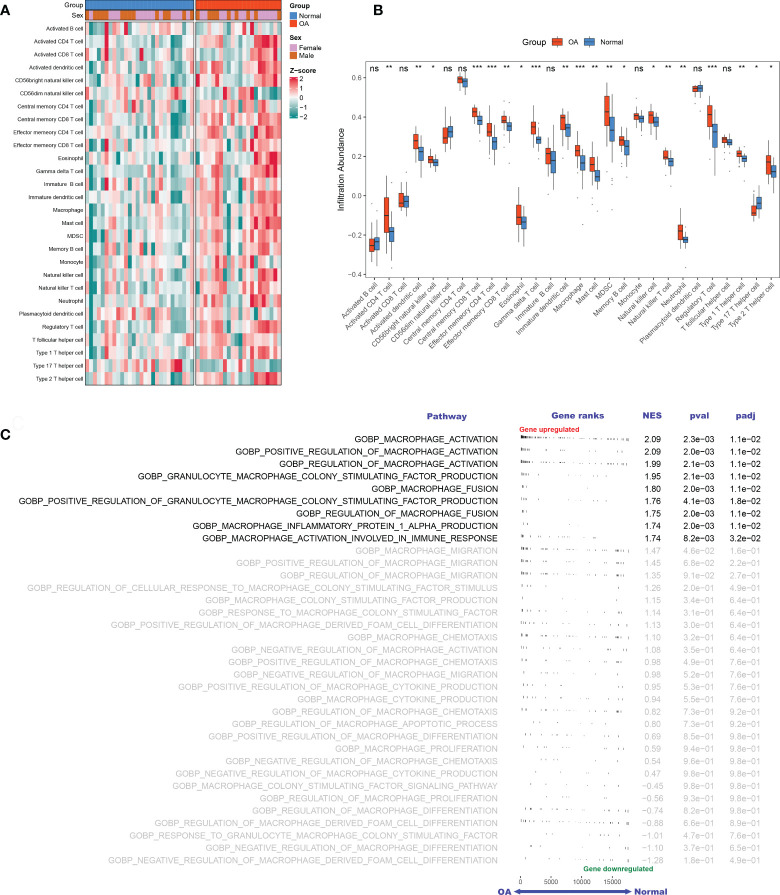
Figure 2.
The landscape of immune infiltration and aberrant signaling pathways. A-B. Heatmap (A) and comparison boxplot (B) of 28-immune-cell infiltration between OA and control groups. ns, (not significant) P > 0.05; *P < 0.05, **P < 0.01, ***P < 0.001. (C). GSEA analysis of 35 macrophage-associated biological pathways between OAs and controls. NES, normalized enrichment score.

