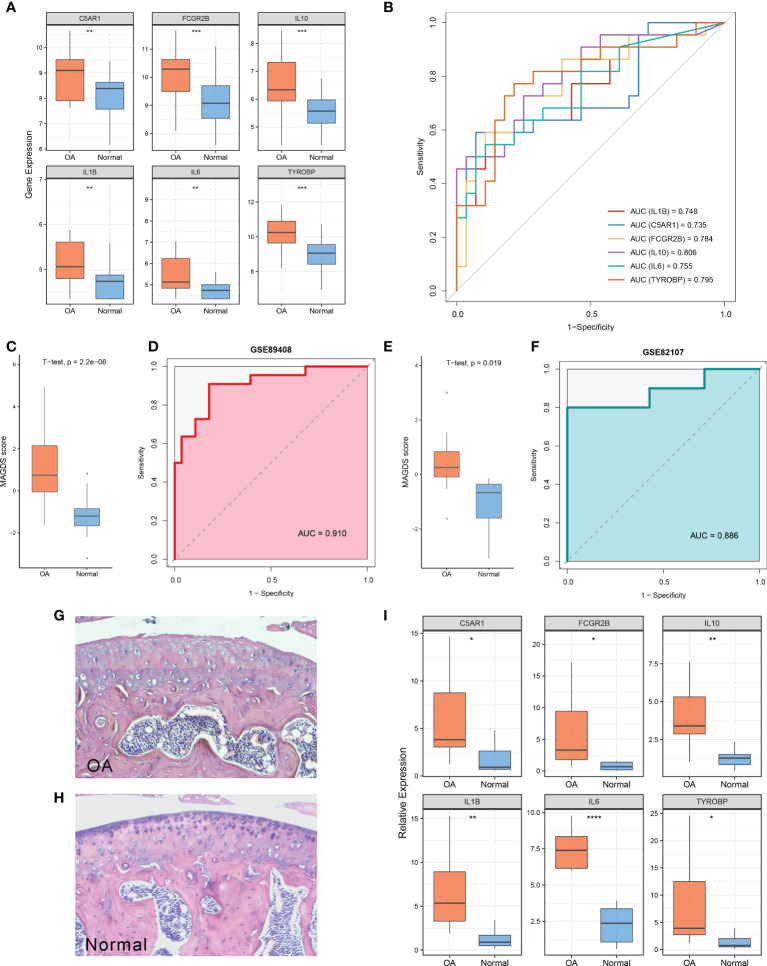
Figure 5.
Diagnostic and predictive values of MAGDS. (A) Differential expression of the six model MAGs between OA and normal groups. (B) ROC analysis of the six key MAGs for OA diagnosis. (C) The distribution of MAGDS scores between OAs and controls in GSE89408. (D) ROC analysis of MAGDS for OA diagnosis in GSE89408. (E) The distribution of MAGDS scores between OAs and controls in GSE82107. (F) ROC analysis of MAGDS for OA diagnosis in GSE82107. (G, H). HE staining of paraffin sections of knee joints from OA (G) and normal mice (H). Magnification, ×100. (I) Relative expression of the six model MAGs between OA and normal mice. Statistic tests: two-sided t-test. ns P > 0.05, *P < 0.05, **P < 0.01, ***P < 0.001, and ****P < 0.0001.

