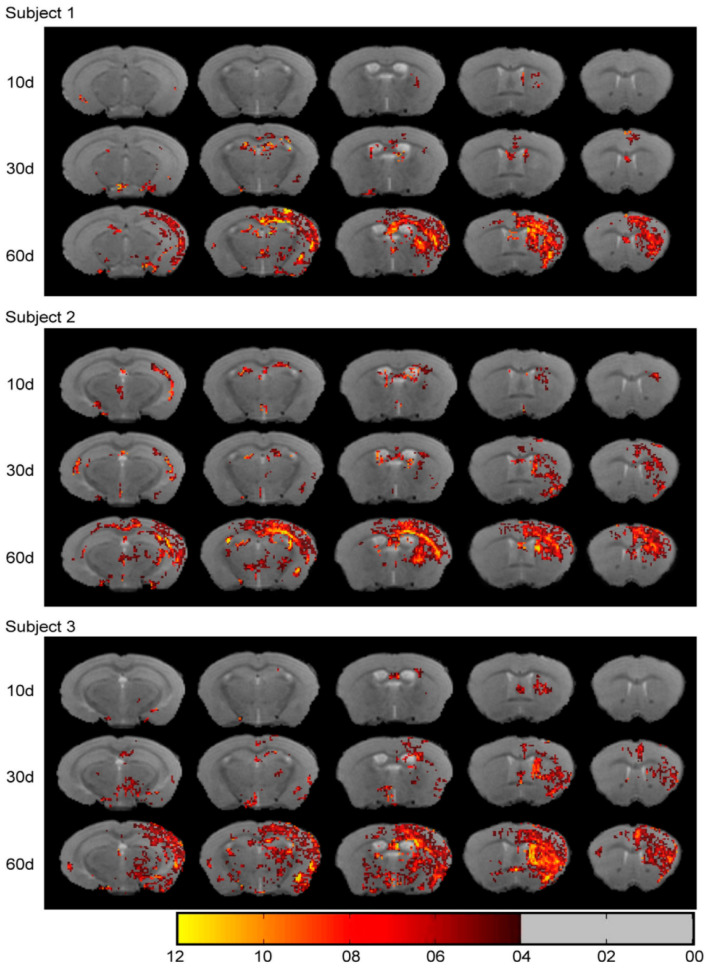
Figure 4.
After different times (10 days, 30 days, or 60 days) of the rAAV2-retro–CAG–Ferritin injection, the CPU connection area is displayed by MRI in vivo (expressed by the change in T2 relaxation times). A color change (red–yellow) is used to indicate a change in T2 relaxation time (4–12 ms). Reproduced with permission from Ref. [33], 2021, Wiley.

