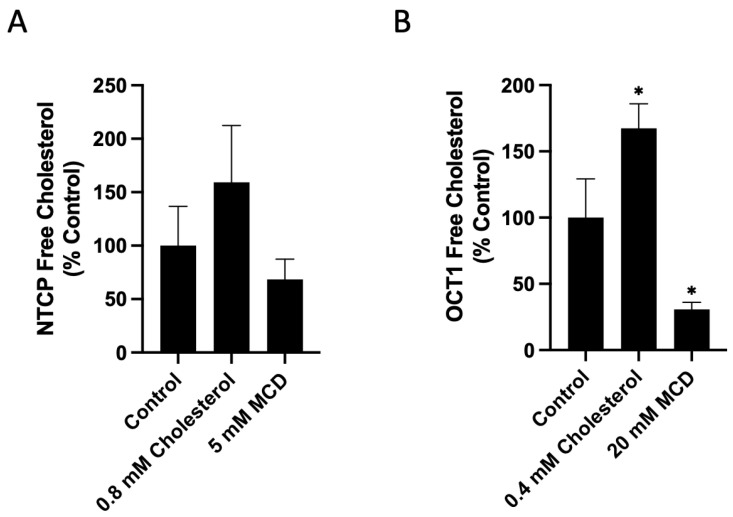
Figure 3.
Free cholesterol content in transporter-expressing HEK293 cells. (A) NTCP- and (B) OCT1-expressing HEK293 cells were treated for 30 min with either Opti-MEM (control) or the indicated concentrations of cholesterol or MCD. The graphs represent the mean ± SD of 3 experiments for NTCP- and 4 experiments for OCT1-expressing cells; an asterisk indicates a p < 0.05 compared to the control group.

