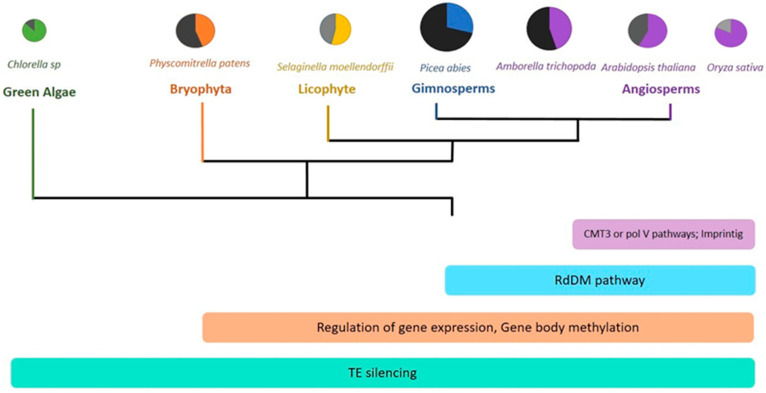
Figure 3.
DNA methylation during plant evolution. The diameter of the colored circles represents the genome size of selected species; the dark slice represents the percentage of repeated sequences, and the intensity of the gray represents the level of global DNA methylation. Across plant evolution, DNA methylation assumes new roles represented by colored rectangles. The TE silencing constitutes the most conserved function of methylation. More recently, novel regulation pathways have emerged.

