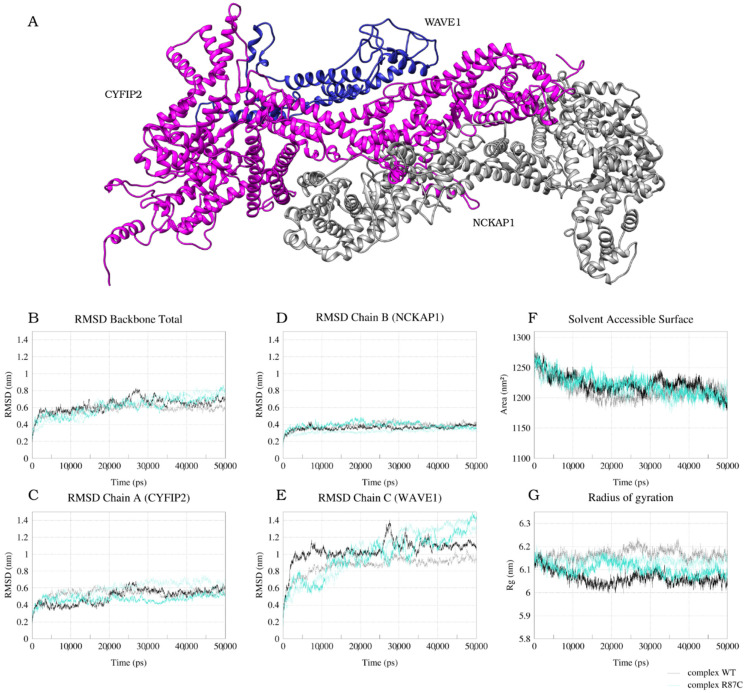
Figure 1.
Structure and conformational evolution through the entire MD simulation of WT and R87C complex models. Ribbon representation of CYFIP2 (magenta), NCKAP1 (gray), and WAVE1 (blue) model (A). Plot of root-mean-square deviation (RMSD) calculated using the original model as a reference for the backbone of all chains (B), CYFIP2 chain (C), NCKAP1 chain (D), and WAVE1 chain (E). Plot of solvent-accessible surface area (SASA) (F). Plot of the radius of gyration (Rg) (G). Data for complex WT simulation are represented by dark (first replica) and light (second replica) gray lines. Data for complex R87C simulation are represented by dark (first replica) and light (second replica) cyan lines.

