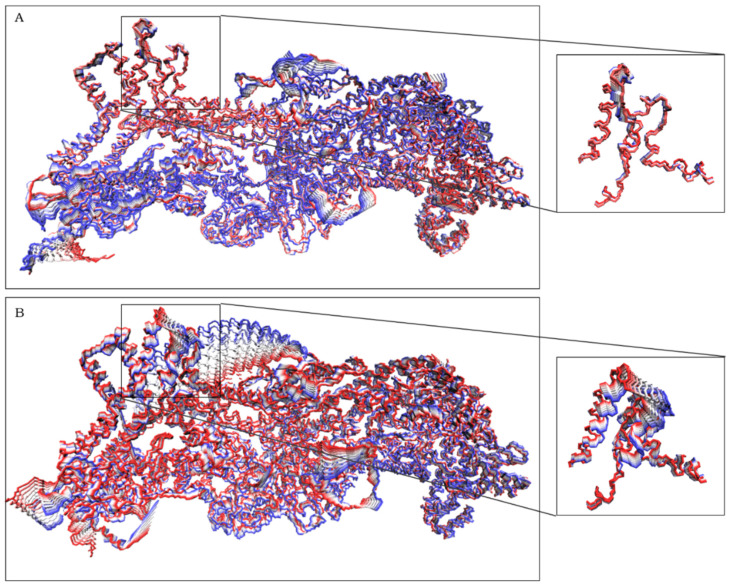
Figure 2.
Projections of the trajectories from both replicas over the first vector for complex WT (A) and complex R87C (B). On the right are highlighted residues 80–120 from CYFIP2 and 131–161 from WAVE1. Ten frames per trajectory are shown from the highest positive (red) to the highest negative (blue) eigenvalues.

