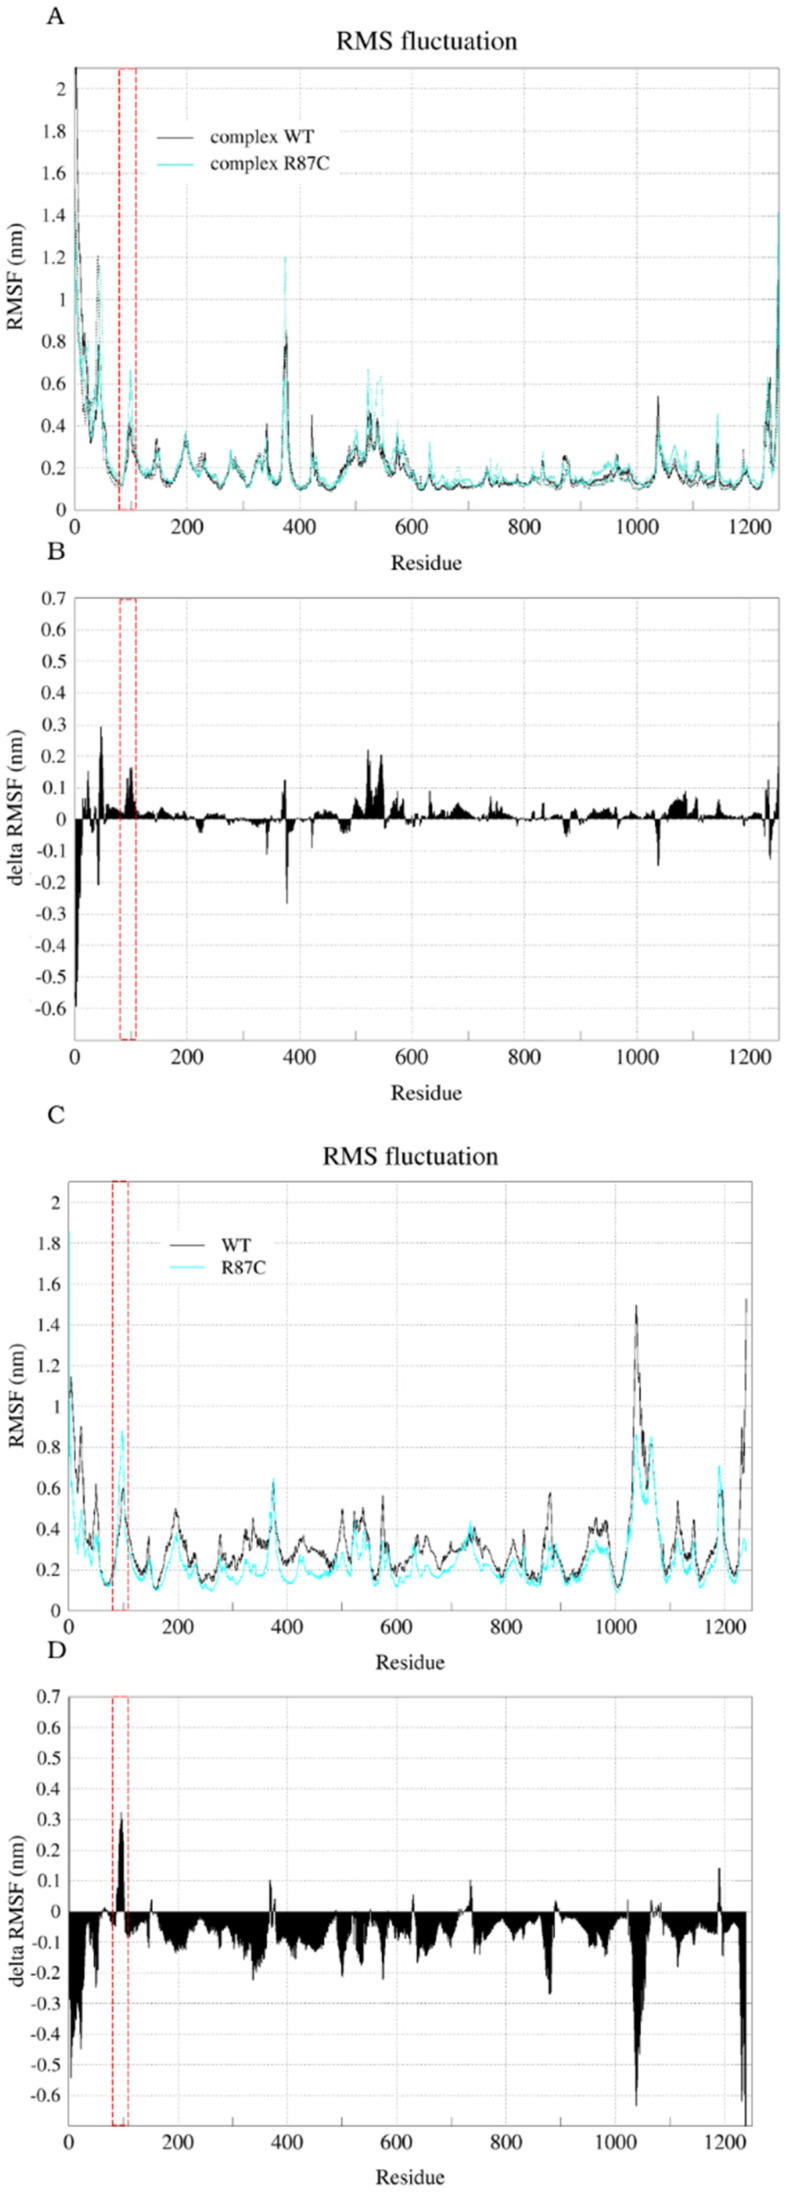
Figure 5.
RMSF (calculated with reference to the average structure fitting of C-alphas for the entire structure through the entire trajectory) and delta RMSF for CYFIP2. Root-mean-square fluctuation (RMSF) for each residue ((A)—complex and (C)—isolated CYFIP2). The delta RMSF values ((B)—complex and (D)—isolated CYFIP2) were calculated based on the difference in RMSF for each residue (mean of both replicas) in the R87C simulation and the WT simulation. Positive values along the sequence indicate an increase in the flexibility in the mutant. Data for complex WT simulation are represented by dark (first replica) and light (second replica) gray lines. Data for complex R87C simulation are represented by dark (first replica) and light (second replica) cyan lines. Data for the CYFIP2 WT simulation are represented by black lines. Data for the CYFIP2 R87C simulation are represented by cyan lines. Red box highlights the region between residues 80–110 in all graphs.

