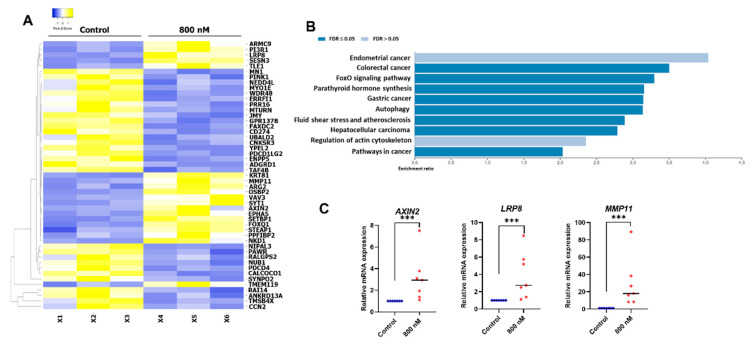
Figure 4.
BIO-treated hDPSC gene expression profile. (A) RNA sequencing analysis was performed. Heatmap showed the top 50 significant differentially regulated genes. (B) KEGG pathway database enrichment analysis for the differentially expressed genes was performed by WebGestalt. (C) The differential gene expression of AXIN2, LRP8, and MMP11 was confirmed using a real-time polymerase chain reaction. Bars indicate a significant difference between groups (*** p < 0.001).

