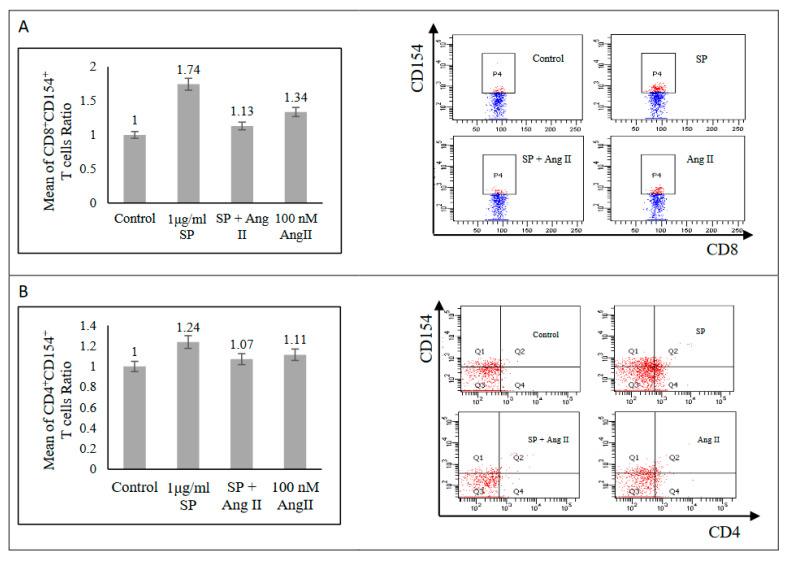
Figure 2.
Activated T-cells surface markers of recovered COVID-19 patients. (A) Left: CD8+ CD154+ T-cells (n = 4). Right: FACS representative plot. (B) Left: CD4+ CD154+ T-cells (n = 4). Right: FACS representative plot. The ratio of T-cells responses was measured as the mean of the percentage of the cell surface marker-positive T-cells in each group to the percentage of the cell surface marker-positive T-cells in the control group after the stimulation of PBMCs with a SARS-CoV-2 peptide pool (SP), angiotensin II (Ang II), or both of a SP and Ang II.

