Figure 2.
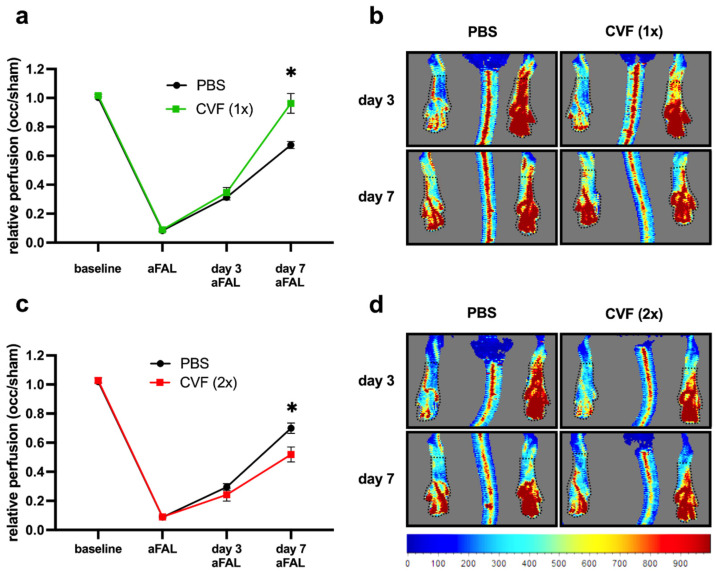
Impact of CVF administration on the perfusion after femoral artery ligation (FAL). (a,b) Single-dose application of the cobra venom factor (CVF (1x)) promotes perfusion recovery. (a) The line graph describes laser Doppler perfusion measurements of the hindlimbs from mice treated with a single dose of phosphate-buffered saline (PBS) or CVF (1x) 24 h prior to FAL. The relative perfusion was calculated using an occluded/sham (right to left hind limb) ratio before FAL (baseline), directly after FAL (aFAL), at day 3, and at day 7 aFAL. Data are the means ± S.E.M., n = 5 mice per group, * p < 0.05 (PBS vs. CVF (1x)) by two-way analysis of variance (ANOVA) with the Bonferroni multiple comparison test. (b) Representative flux images of laser Doppler measurements from mice treated with a single dose of PBS (left images) or CVF (1x) (right images) showing color-coded the relative perfusion of hind limbs at day 3 and 7 aFAL (blue color indicates low perfusion, and red color indicates high perfusion). Black dotted lines indicate the regions of interest (ROI), which were used for perfusion analyses. (c,d) Repeated treatment of mice with CVF (2x) counteracts the perfusion recovery. (c) The line graph depicts the results of the laser Doppler perfusion measurements of the hind limbs of repeated PBS- or CVF (2x)-treated mice. Some (12.5 µg CVF) were administered by i.p. injection 24 h prior FAL and again 3 days aFAL. The relative perfusion was calculated using the occluded/sham (right to left hind limb) ratio before FAL (baseline), directly aFAL, at day 3, and at day 7 aFAL. Data are the means ± S.E.M., n = 5 per group, * p < 0.05 (PBS vs. CVF (2x)) by two-way analysis of variance (ANOVA) with the Bonferroni multiple comparison test. (d) Representative flux images of laser Doppler measurements from repeated PBS- (left images) or CVF (2x)-treated mice (right images) showing in color code the relative hindlimb perfusion at day 3 and 7 aFAL. Black dotted lines indicate the ROI, which were used for perfusion analyses.

