Figure 1.
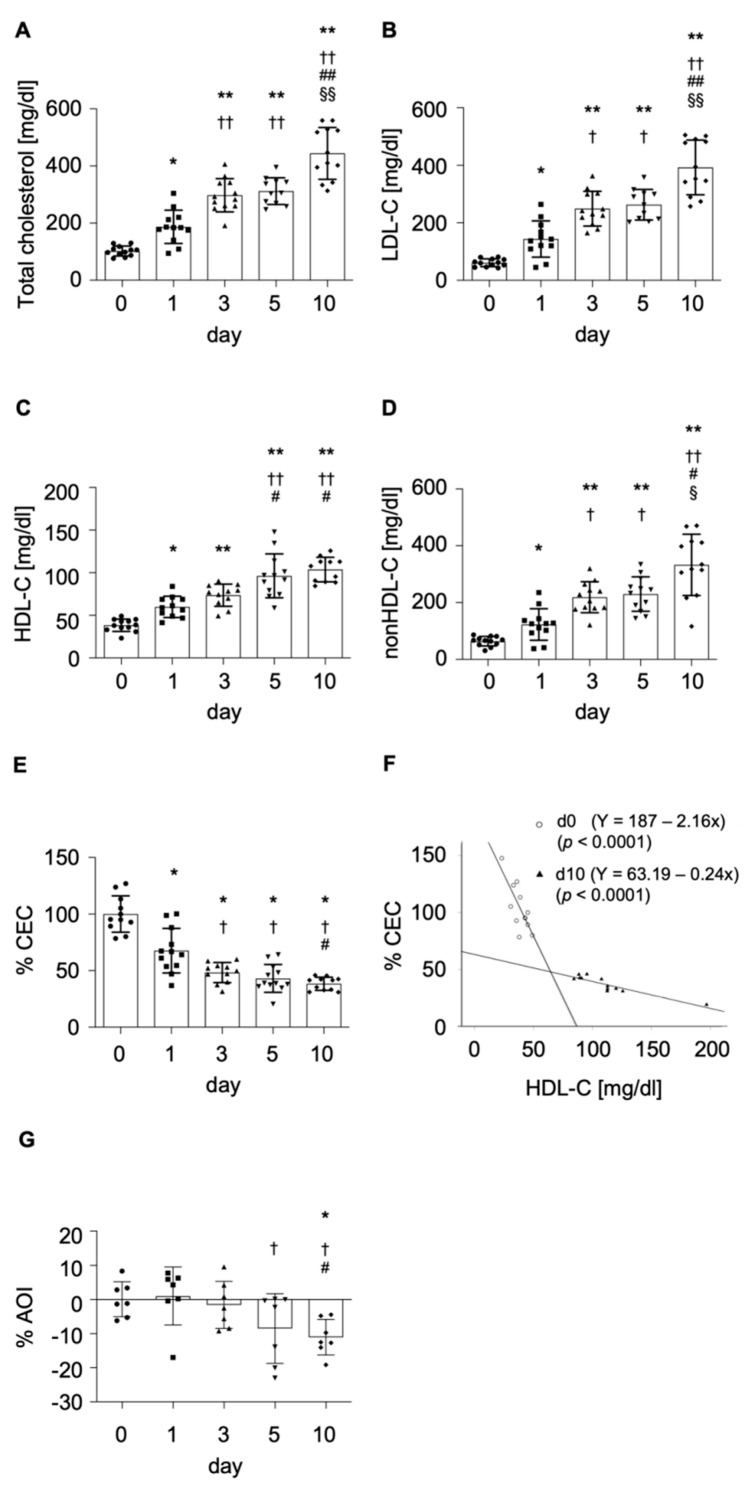
Diet-induced hypercholesterolemia onset increases lipid parameters while HDL function is impaired. Progression of plasma lipid parameters including total cholesterol (A), LDL-C (B), HDL-C (C), non-HDL-C (D), and HDL functional measures cholesterol efflux capacity (CEC) from macrophages to HDL (E), and antioxidant capacity (G) are depicted during the first 10 days of HC diet. The correlation between cholesterol efflux capacity and HDL-C levels (d0 and d10 (F) is shown with linear regressions. Individual values are depicted with bars representing the mean ± SD over time. Shapiro–Wilk test confirmed normality (alpha = 0.05), and data were analyzed by one-way ANOVA with Tukey’s multicomparison test and considered significant with a p-value < 0.05. * p < 0.05, ** p < 0.0001 in comparison to day 0; † p < 0.05, †† p < 0.0001 in comparison to day 1; # p < 0.05, ## p < 0.0001 in comparison to day 3; §§ p < 0.0001, § p < 0.05 in comparison to day 5. LDL-C: low-density lipoprotein cholesterol; HDL-C: high-density lipoprotein cholesterol; CEC: cholesterol efflux capacity; AOI: antioxidant index.

