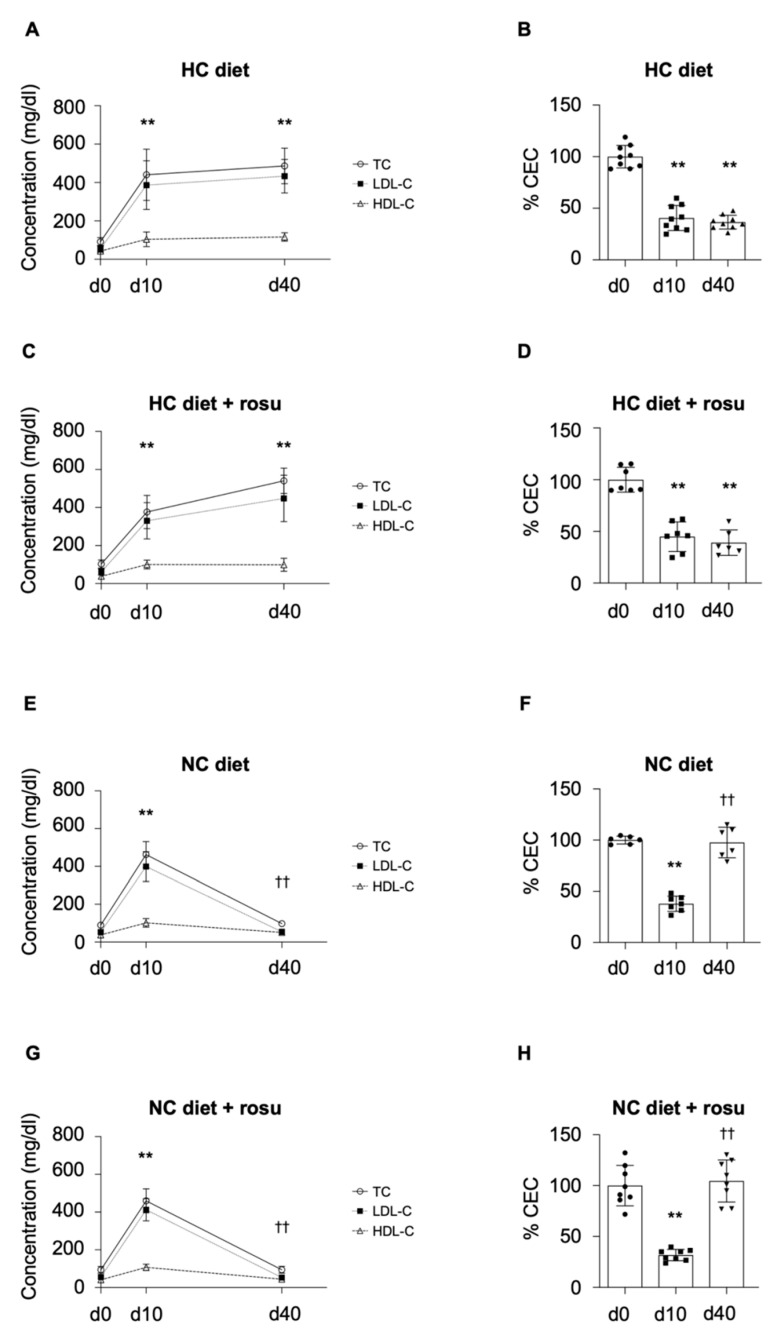
Figure 2.
Effects of diet and rosuvastatin intervention on lipid parameters and CEC. Changes in plasma total cholesterol (TC, circle with continuous line), low-density lipoprotein cholesterol (LDL-C, square with dotted line), and high-density lipoprotein cholesterol (HDL-C, triangles with dashed line) levels (A,C,E,G), and percent cholesterol efflux from macrophages to HDL (% Efflux; B,D,F,H) are depicted as mean (bars or line through respective symbol) ± SD (whiskers) for all four groups over the period of 40 days. Shapiro–Wilk test confirmed normality (alpha = 0.05), and data were analyzed by unpaired t-test and considered significant with a p-value < 0.05. ** p < 0.0001 in comparison to day 0; †† p < 0.0001 in comparison to day 10. CEC: cholesterol efflux capacity; TC: total cholesterol; HDL: high-density lipoprotein cholesterol; LDL: low-density lipoprotein cholesterol; HC: hypercholesterolemic; NC: normocholesterolemic; rosu: rosuvastatin; d0–40: day 0–40.

