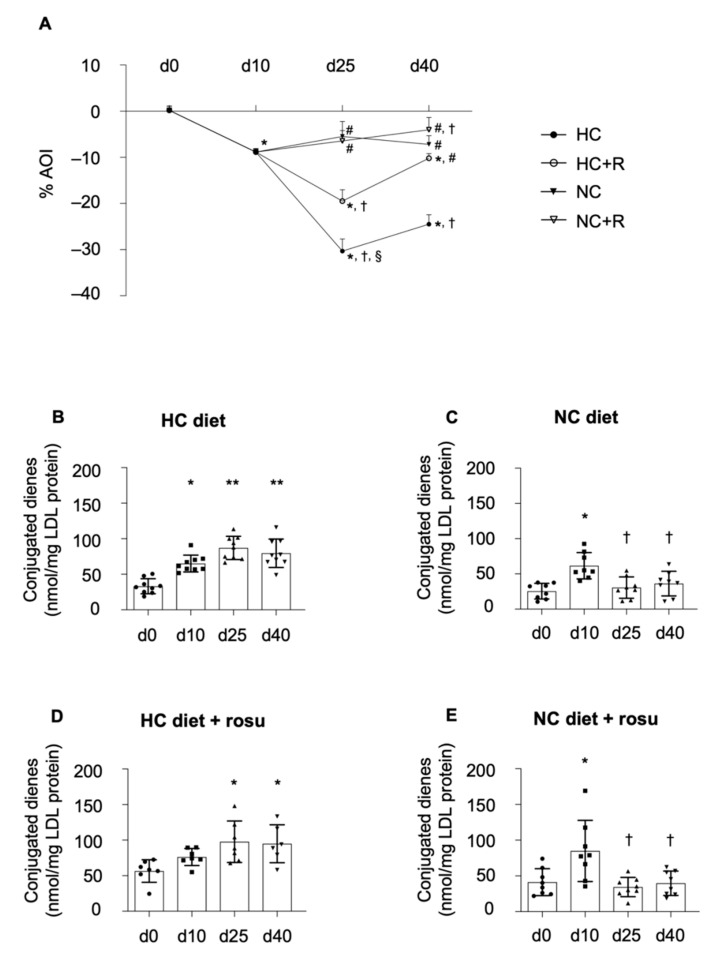
Figure 3.
Effects of diet and rosuvastatin intervention on HDL antioxidant capacity. Changes in HDL antioxidant capacity are presented as percent antioxidant index ((A), % AOI; measure for capacity to reverse LDL oxidation) and levels of conjugated dienes ((B–E) product of lipid oxidation). Data are shown as mean ± SEM ((A); for visual clarity of the graph) or SD (whiskers) over the period of 40 days. (A) includes all four groups, whereas (B–E) represent each group individually. Shapiro–Wilk test confirmed normality (alpha = 0.05), and data were analyzed by one-way ANOVA with Tukey’s multicomparison test and considered significant with a p-value < 0.05. For (A): * p < 0.05 in comparison to day 0; † p < 0.05 in comparison to day 10; # p < 0.05 compared to HC; § p < 0.05 in comparison to NC. For (B–E): * p < 0.05, ** p < 0.0001 in comparison to day 0; † p < 0.05 in comparison to day 10. d0–40: day 0–40; HC: hypercholesterolemic diet; NC: normocholesterolemic diet; +R/+rosu: + rosuvastatin; LDL: low-density lipoprotein.

