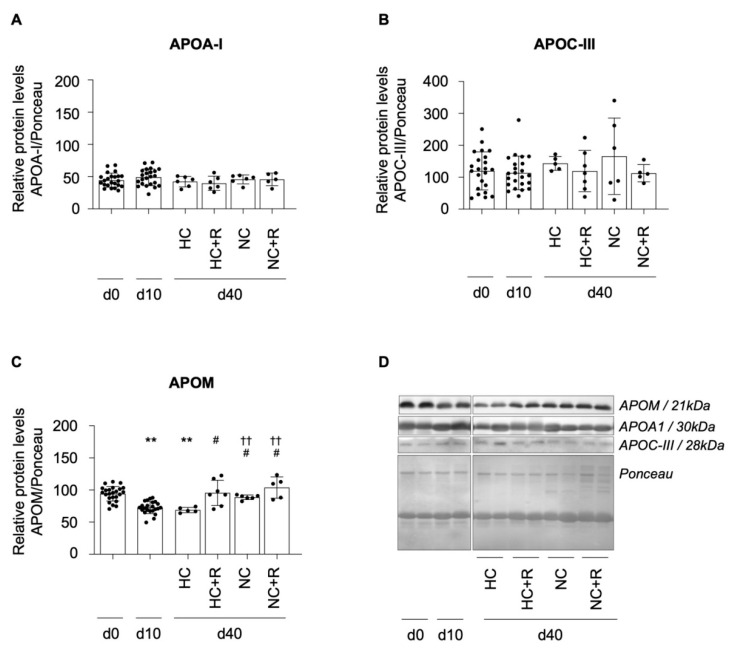
Figure 4.
Effects of diet and rosuvastatin intervention on HDL apolipoprotein levels. Changes in protein levels of apolipoproteins (APO) APOA-I (A), APOC-III (B), and APOM (C) in isolated HDL particles are presented as relative quantification and representative Western blots (D) at study endpoint. Western blot quantifications are shown as mean ± SD. Shapiro–Wilk test confirmed normality (alpha = 0.05), and data were analyzed by unpaired t-test and considered significant with a p-value < 0.05. ** p < 0.0001 in comparison to day 0; †† p < 0.0001 in comparison to day 10; # p < 0.05 in comparison to day 40 of animals on HC diet. d0–40: day 0–40; HC: hypercholesterolemic diet; NC: normocholesterolemic diet; +R: + rosuvastatin.

