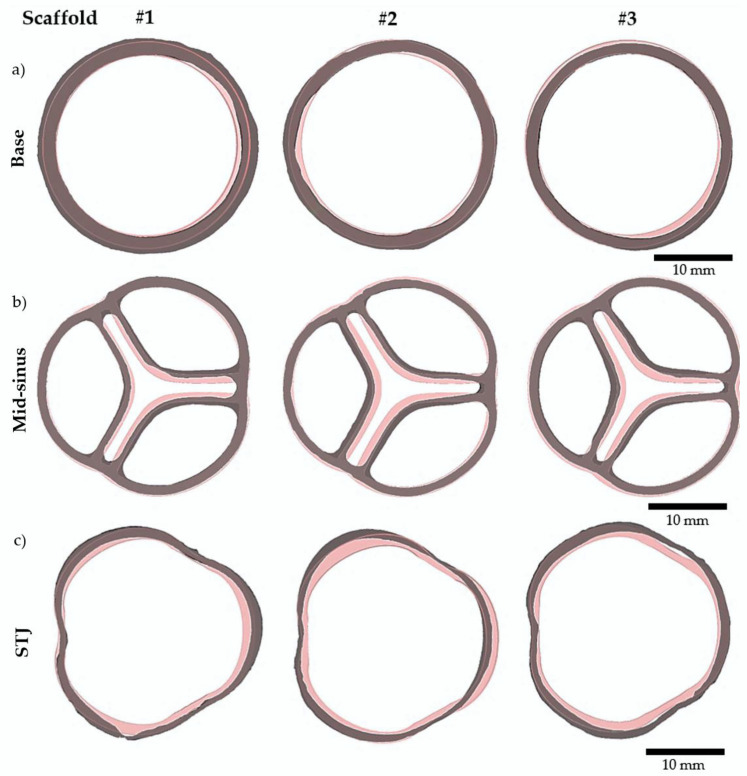
Figure 6.
Three aortic valve scaffolds were compared to the original computer-designed model. Images generated after 3D reconstruction of micro-CT scans of n = 3 scaffolds are shown in grey. The original computer-designed model to which a uniform contraction of 13% was imposed is shown in pink. (a) Base slices. (b) Mid-sinus slices. (c) STJ (sino tubular junction) slices.

