Figure 1.
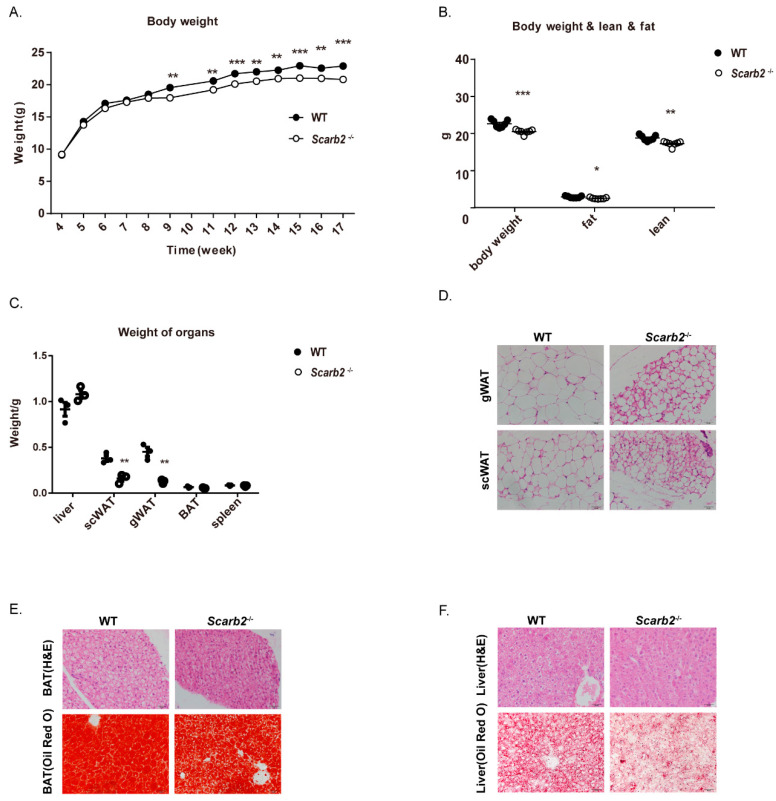
Scarb2−/− mice show less lipid accumulation on a regular chow diet. (A) Body weights of female WT and Scarb2−/− mice on a regular chow diet between 4–17 weeks. n = 7. (B) Body composition of female WT and Scarb2−/− mice measured by DEXA after 13 weeks on a regular chow diet. n = 7. (C) Weight of liver, gWAT, scWAT, BAT, spleen of 20-week-old female WT and Scarb2−/− mice (n = 3). (D) HE staining of gWAT and scWAT sections from 20-week-old female WT and Scarb2−/− mice. Scale bars, 20 μm. (E) HE and Oil Red O staining of BAT sections from 20-week-old female WT and Scarb2−/− mice. Scale bars, 20 μm. (F) HE and Oil Red O staining of liver sections from 20-week-old female WT and Scarb2−/− mice. Scale bars, 20 μm. DEXA: dual-energy X-ray absorptiometry, scWAT: subcutaneous white adipose tissue, gWAT: gonadal white adipose tissue, BAT: brown adipose tissue. Data are represented as mean ± SEM. * p < 0.05, ** p < 0.01, *** p < 0.001.

