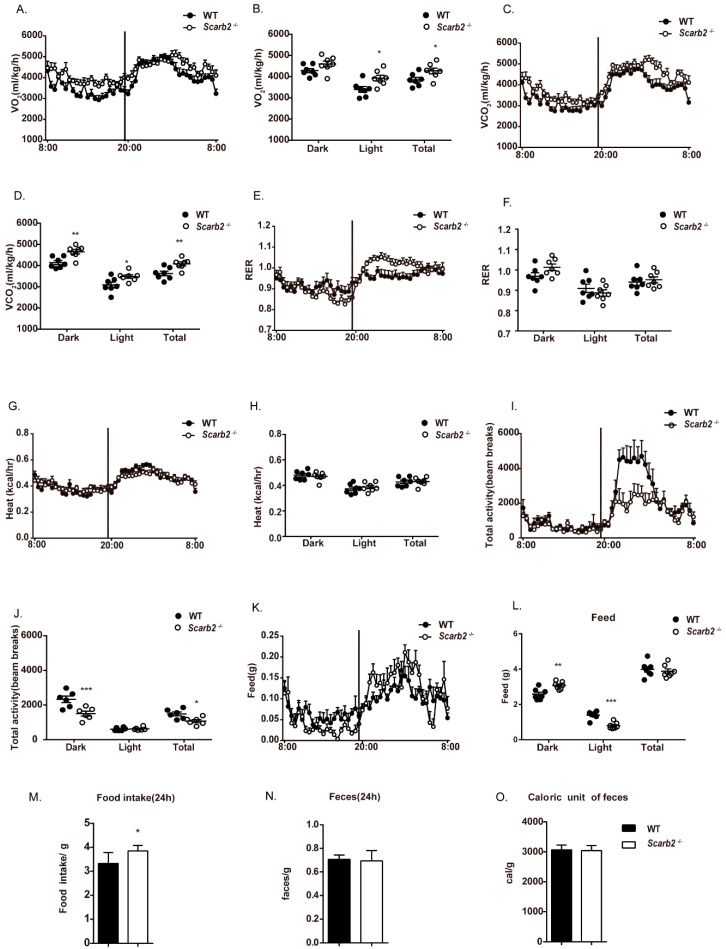
Figure 2.
Metabolic phenotype analysis of female Scarb2−/− mice on a regular chow diet. (A–L) Indirect calorimetry of 16-week-old female WT and Scarb2−/− mice: (A,B) VO2: oxygen consumption. (C,D) VCO2: CO2 generation. (E,F) RER: respiration exchange rate, VCO2/VO2. (G,H) HEAT: heat generation. (I,J) Total activity. (K,L) FEED: food intake. n = 7. The line chart represents real time value of 24 h for 2 day average. The column chart represents an average value during the light cycle (8:00~20:00) and dark cycle (20:00~8:00). (M) Food consumption over 24 h of 8-week-old WT and Scarb2−/− mice (data represent the average of three days). n = 6 per genotype. (N) Faces weight over 24 h of 8-week-old WT and Scarb2−/− mice. n = 6 per genotype. (O) Assessment of energy harvest in 8-week-old WT and Scarb2−/− mice fed regular chow diet using fecal bomb calorimetry. n = 6 per genotype. Data are represented as mean ± SEM. * p < 0.05, ** p < 0.01, *** p < 0.001.

