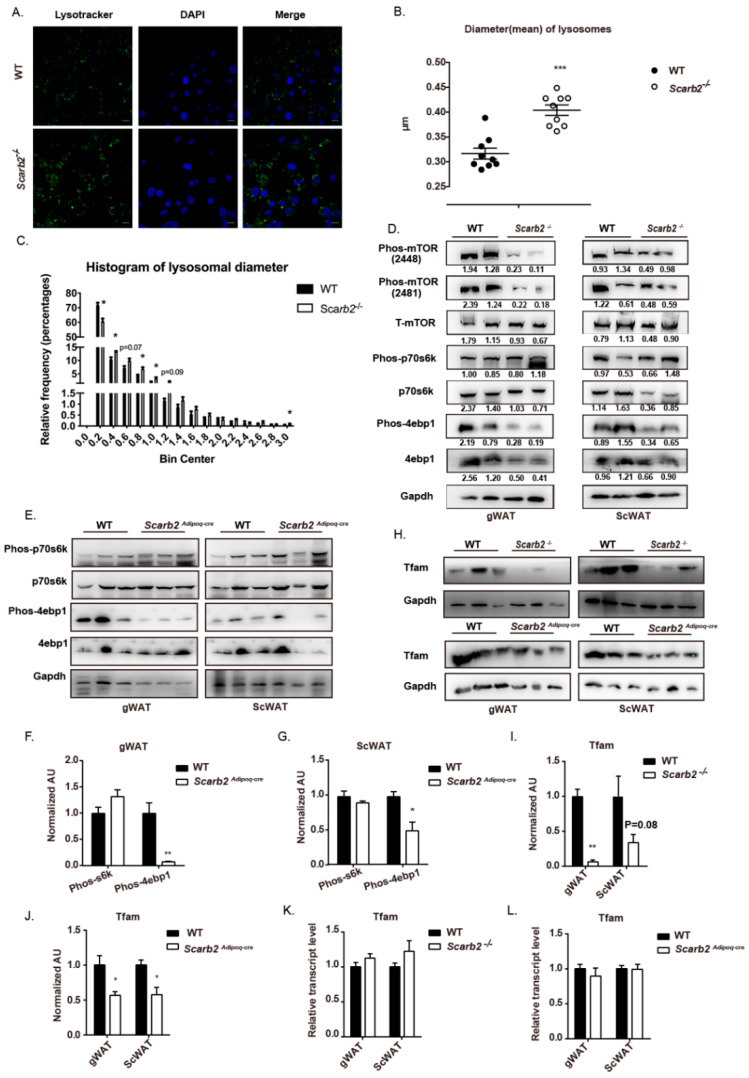
Figure 6.
mTORC1 pathway is impaired in Scarb2−/− and Scarb2Adipoq-cre WAT. (A) Immunofluorescence of mature adipocytes differentiated from pre-adipocytes of WT and Scarb2−/− mice stained with Lysotracker DND-26 (green) and DAPI (blue). Scale bars, 10 μm. (B) The statistical result of mean diameter of lysosomes in pre-adipocytes of WT and Scarb2−/− mice. n = 9. (C) Histogram of diameter of lysosomes in pre-adipocytes of WT and Scarb2−/− mice. n = 9. (D) Immunoblot analysis of Phos-mTOR (2448 and 2481), Total-mTOR (T-mTOR), Phos-p70s6k, p70s6k, Phos-4ebp1, 4ebp1 and Gapdh in WT and Scarb2−/− mouse WAT was shown. The value of gray scale analysis were calculated by Image J and labeled below bands. Phos-mTOR (2448), Phos-mTOR (2481), Phos-p70s6k and Phos-4ebp1 were normalized to the respective total protein, p70s6k, T-mTOR and 4ebp1 were normalized to GAPDH. (E) Immunoblot analysis of Phos-p70s6k, p70s6k, Phos-4ebp1, 4ebp1 and Gapdh in gWAT or scWAT of WT and Scarb2Adipoq-cre mice was shown. (F,G) The gray scale analysis of phos-s6k/s6k and phos-4e-bp1/4e-bp1 in (E). All the data were normalized to the mean value of phos-s6k/s6k or phos-4e-bp1/4e-bp1 in WT group, respectively. (H) Immunoblot analysis of Tfam and Gapdh in gWAT or scWAT of WT, Scarb2−/− and Scarb2Adipoq-cre mice was shown. (I,J) The gray scale analysis of Tfam /Gapdh in (H). All the data were normalized to the mean value of Tfam /Gapdh in WT group. (K) The mRNA levels of Tfam in WAT of WT and Scarb2−/− mice analyzed by real-time quantitative PCR. n = 4. Expression levels of target genes were normalized to Rplp0 (alias 36B4). All the data were normalized to the mean value of WT group. (L) The mRNA levels of Tfam in WAT of WT and Scarb2Adipoq-cre mice analyzed by real-time quantitative PCR. n = 4. Expression levels of target genes were normalized to Rplp0 (alias 36B4). All the data were normalized to the mean value of WT group. scWAT: subcutaneous white adipose tissue, gWAT: gonadal white adipose tissue. Data are shown as means ± SEM. * p < 0.05, ** p < 0.01, *** p < 0.001.

