Figure 5.
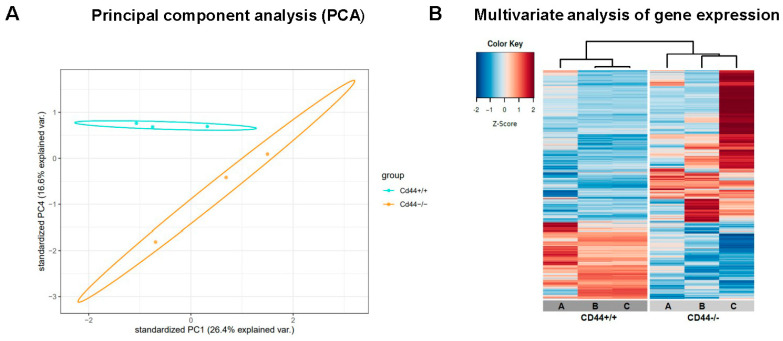
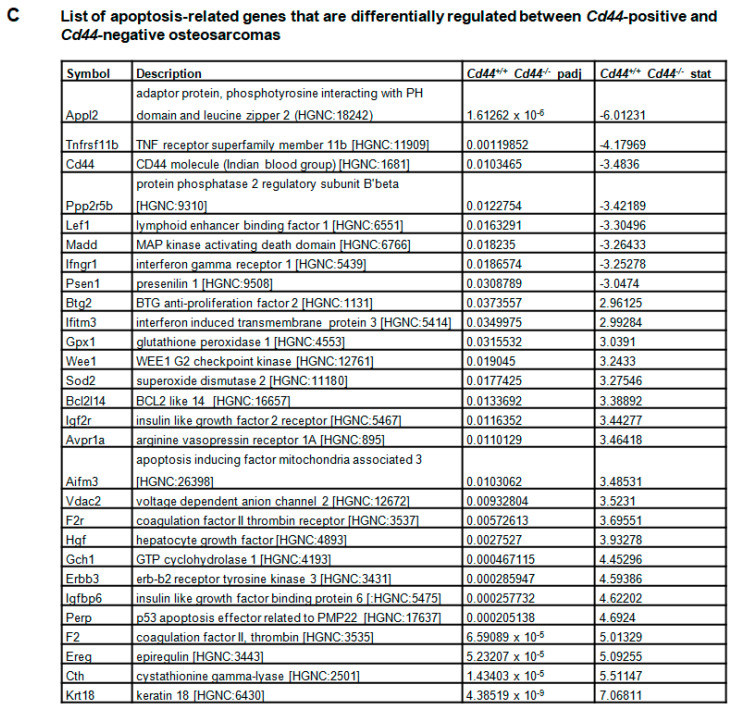
Gene expression analysis. (A) Principal component analysis (PCA) of RNA sequencing data. Data were plotted along the first and forth principal components. Each dot in PCA plot indicates a single sample. (B) Multivariate analysis of gene expression between Cd44-positive and Cd44-negative primary osteosarcomas. Unsupervised hierarchical clustering and heatmap showing Cd44+/+ and Cd44−/− primary osteosarcomas clearly segregated from one another, based on their RNA expression profiles. Three samples of each group were analyzed. Both downregulated (blue) and upregulated (red) RNAs were identified in Cd44−/− osteosarcomas. The analysis was performed using an MADE4 package of R software. (C) List of apoptosis-related genes that are differentially regulated between Cd44-positive and Cd44-negative osteosarcomas. The data are represented as Wald-statistic (stat). Genes with negative Wald-statistic values are down-regulated in Cd44−/− compared to Cd44+/+ primary osteosarcomas, and genes with positive values are upregulated. Benjamin Hochberg adjusted p-value (padj) is indicated. Gene description source: HGNC (www.genenames.org/, accessed on 31 May 2022).


