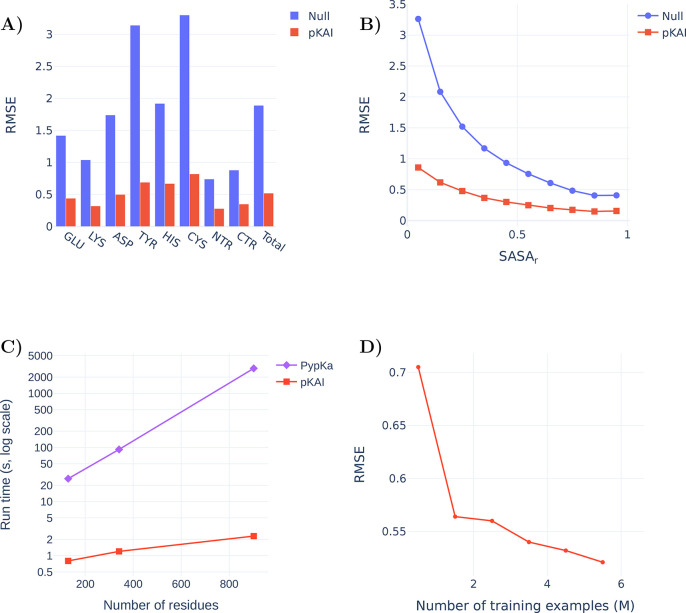
Figure 2.
(A) Comparison of the RMSE values between from the Null model and pKAI (values are shown in Supplementary Table S2). The Null model is defined as the pKa values of the residues in water taken from ref (41). (B) Performance at predicting the dependency of the pKasingle values on the magnitude of solvent exposure (SASA). The calculations were performed for the pKAI and Null models using the PypKa predictions as a reference. (C) Execution time comparison between PypKa and pKAI (values are shown in Supplementary Table S3). This benchmark was executed on a machine with a single Intel Xeon E5–2620 processor. (D) Effect of the size of the training set on the model performance for the validation set.

