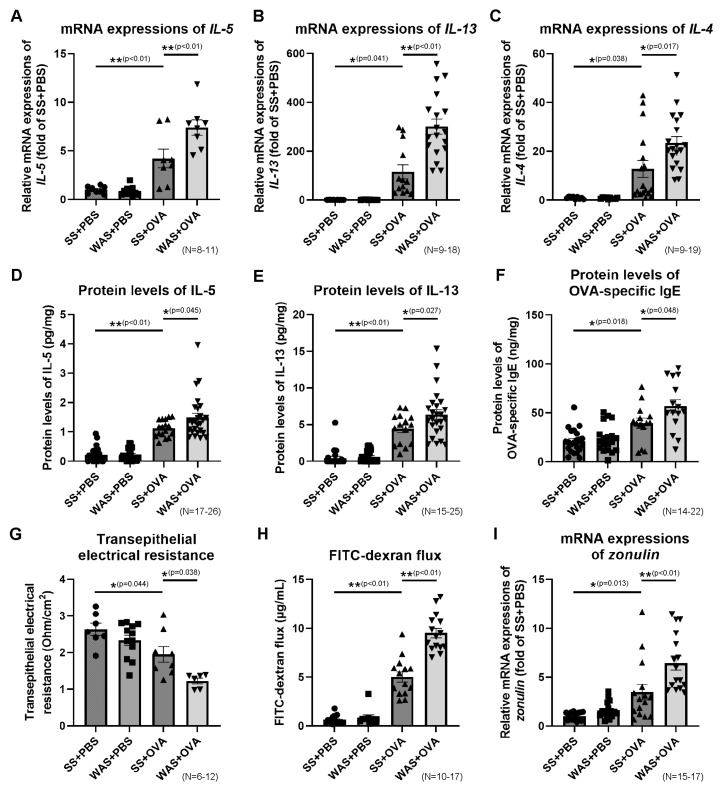
Figure 3.
The expressions of Th2 cytokines and OVA-specific IgE in the ileum, and ileal permeability. The mRNA expressions of IL-5 (A), IL-13 (B), and IL-4 (C). Protein levels of IL-5 (D), IL-13 (E), and OVA-specific IgE (F). (G) Ex vivo ileal permeability evaluated using TEER. (H) Ex vivo ileal permeability evaluated using the FITC-dextran flux. (I) mRNA expression of zonulin. * p < 0.05, ** p < 0.01. FITC, fluorescein isothiocyanate; IgE, immunoglobulin E; IL, interleukin; OVA, ovalbumin; TEER, transepithelial electrical resistance; Th2, type 2 helper T cell.

