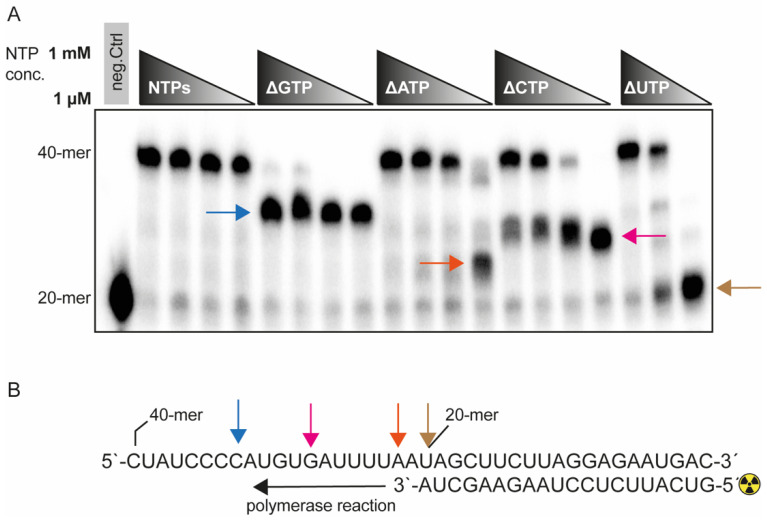
Figure 3.
Effect of NTP depletion–SARS-CoV-2 RdRp is sensitive to GTP depletion. (A) The polymerase reaction (as described in Figure 1A) was performed under decreasing concentrations of NTPs at 1 mM, 100 μM, 10 μM, and 1 μM. For ΔUTP, the range was 1 mM, 10 μM and 1 μM. Subsequently the NTP pool was depleted for each NTP individually. A negative control in lane 1 contained the heat-denatured protein complex, indicating the 20-mer that is not elongated. Lanes 2–5 indicate decreasing concentration of a pool of all four NTPs. Lanes 6–9, ΔGTP, are an NTP pool lacking GTP and stalling at position 12 (blue arrow). In lanes 10–13, the ΔATP condition is shown, indicating stalling at 1 μM NTP concentration at position 2 (brown arrow). Lanes 14–17, ΔCTP, indicate stalling at position 8 (magenta arrow). Lanes 18–20 lack UTP and stall at position 0 at 1 μM NTP concentration (yellow arrow). (B) Polymerase reaction indicating the stalling position. This radiograph is a representative imagine of two independent experiments.

