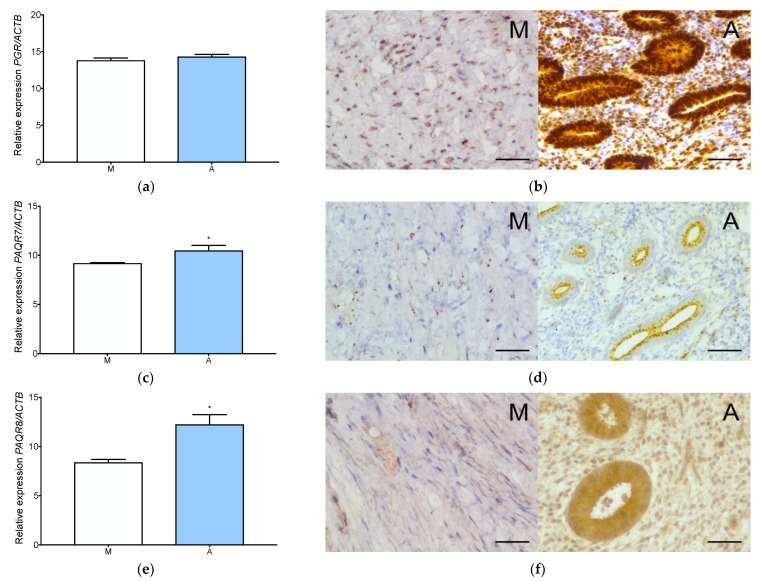
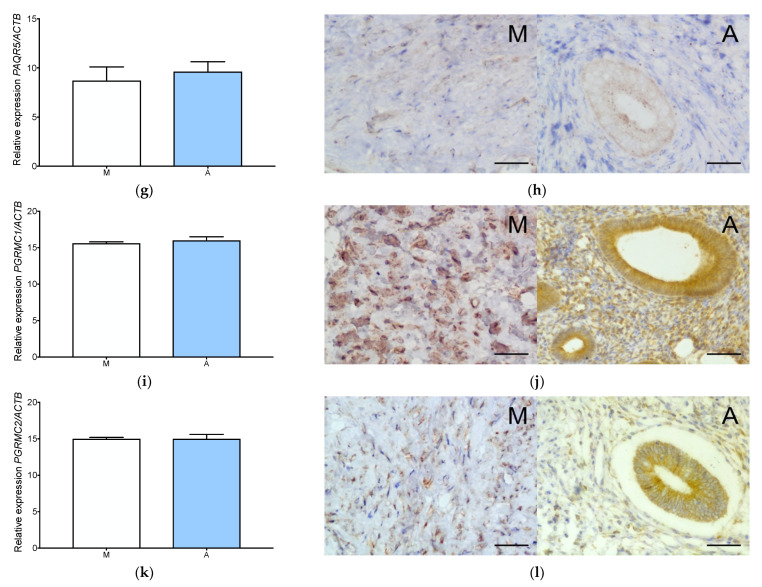
Figure 1.
Progesterone receptors expression in adenomyosis and normal myometrium. Characterization of PGR expression at gene (a) and protein (b) level, PAQR7 gene (c) and protein (d) level, PAQR8 gene (e) and protein (f) level, PAQR5, gene (g) and protein (h) level, PGRMC1 gene (i) and protein (j) level and PGRMC2 gene (k) and protein (l) level. The columns represent the ratio of the expression of the gene tested and ACTB ± SEM. Asterisk indicates significant differences (* p ≤ 0.05). Original magnification, 40×; scale bar, 50 μm. A, adenomyosis; M, myometrium.


