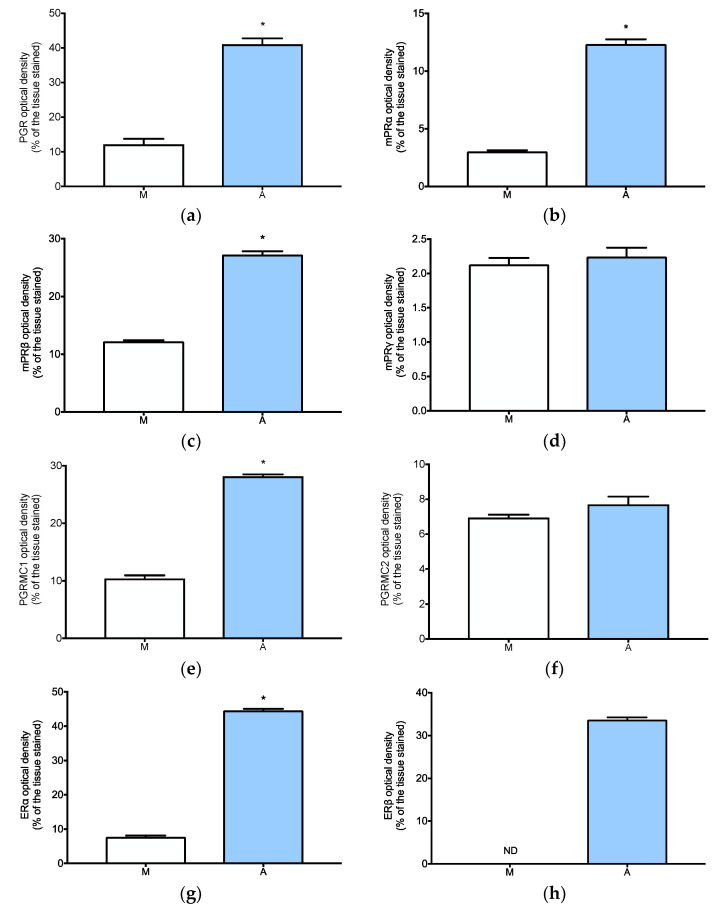
Figure A1.
Quantification of IHC stainings in myometrium and adenomyosis tissues. Fiji (ImageJ) analysis of PGR (a), mPRα (b), mPRβ (c), mPRγ (d), PGRMC1 (e), PGRMC2 (f), ERα (g), ERβ (h), GPER (i) and aromatase (j). The columns represent the mean % of the tissues stained in the analysed fields. Asterisk indicates significant differences (* p ≤ 0.05). A, adenomyosis; M, myometrium.


