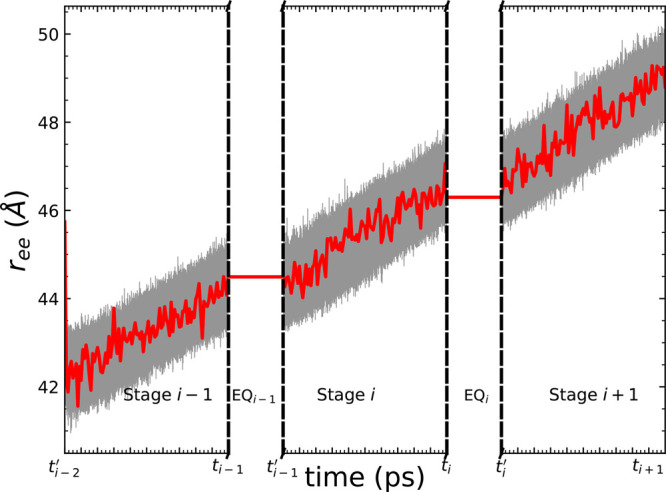
Figure 2.

An illustration of the progression of end-to-end distances of the ensemble of Ala30 structures along the stretching in and between two characteristic stages. The average end-to-end distance ree is shown in red, and the ensemble of trajectories is overlapped in gray. For specificity, the data shown here comes from the pulling of Ala30 for the three stages starting from the initial pull—viz. i = 2 in the notation of the x-axis labels.
