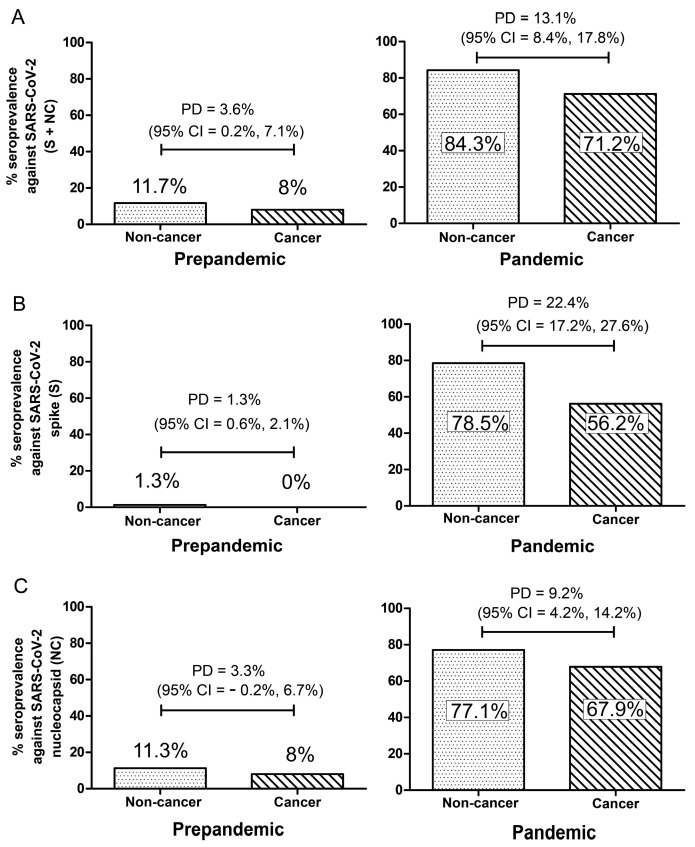
Figure 1.
Seroprevalence against SARS-CoV-2 spike (S) and nucleocapsid (NC) in SSA pandemic plasma samples (right), with pre-pandemic archived samples for comparison (left). (A) S + NC. (B) S alone. (C) NC alone. “PD” represents proportional difference between the groups. “CI” represents confidence intervals.

