Figure 1.
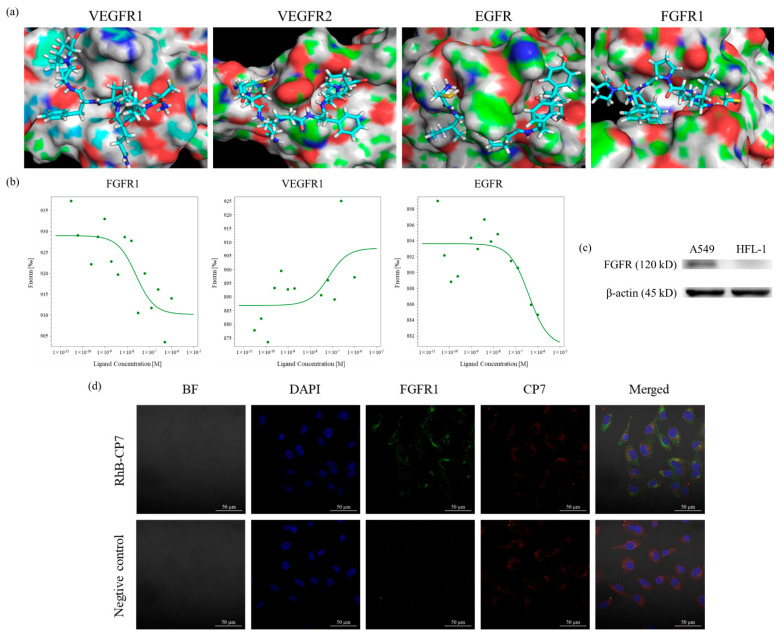
(a) Visualization of binding modes within active sites of VEGFR1, VEGFR2, EGFR, and FGFR1. CP7 is shown in stick representation in the binding pocket of selected targets, and proteins are represented using surface model. (b) Interaction between CP7, FGFR1, VEGFR1, and EGFR detected by MST. (c) Level of FGFR1 protein expressed in A549 and HFL-1 cells determined with Western blot technique. (d) Immunofluorescence colocalization of CP-7 peptide with an antibody specific for FGFR1. Scale bar = 50 μm.

