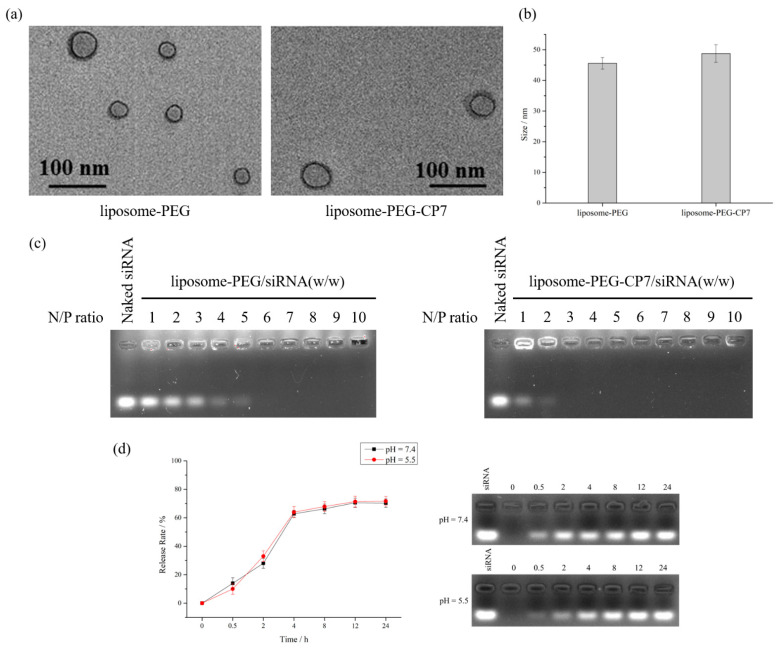
Figure 3.
(a) TEM images of liposome-PEG and liposome-PEG-CP7. (b) Size distribution of liposome-PEG and liposome-PEG-CP7 by dynamic light scattering (DLS) analysis. Data are presented as means ± SD (n = 3). (c) siRNA binding ability of liposome-PEG and liposome-PEG-CP7 evaluated by agarose gel retardation assay. (d) Drug release profiles of liposome-PEG-CP7 in PBS at different pH. The right panel is a typical result of drug release assayed by agarose gel electrophoresis.

