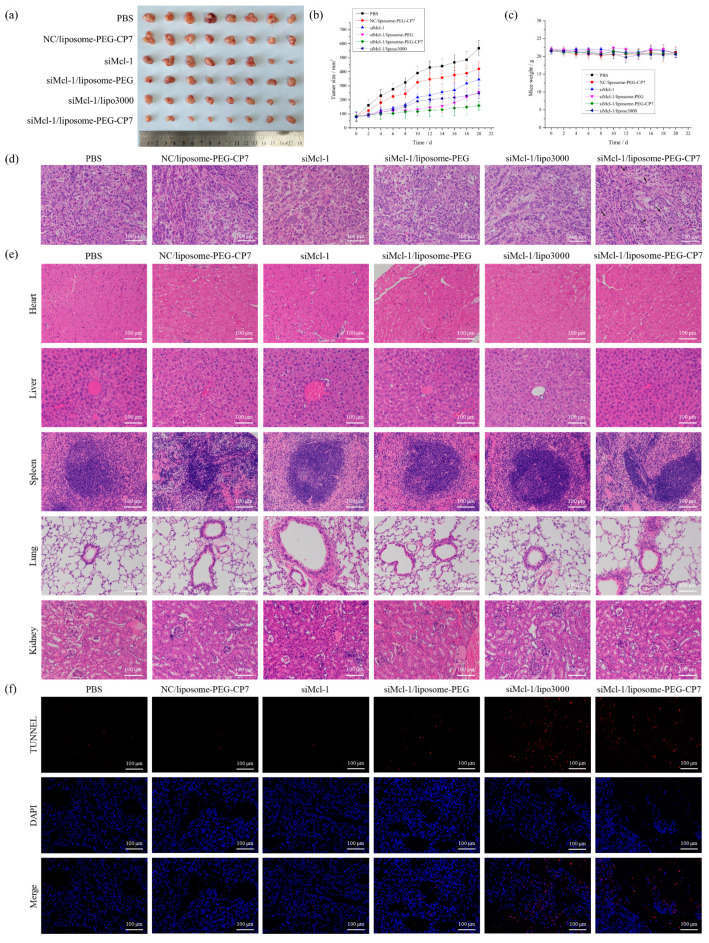
Figure 5.
(a) Photo of tumor tissues from mice treated with PBS, siMcl-1/lipo3000, siMcl-1/liposome-PEG-CP7, siMcl-1/liposome-PEG, NC/liposome-PEG-CP7, and free siMcl-1 at the end of the study. (b) Real-time observation of tumor sizes in vivo after treatment with samples. Error bars represent means ± SD. (c) Real-time weight analysis of mice after each treatment. Error bars represent means ± SD. (d,e) H&E staining of tumor tissue (d) and major organs (heart, liver, spleen, lung, and kidney) (e) after treatment. (f) TUNEL staining of tumor tissue after treatment.

