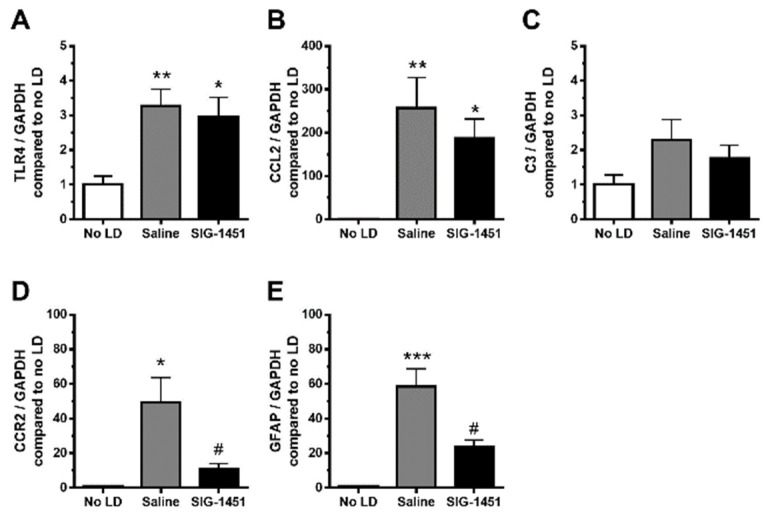
Figure 4.
RT-qPCR analysis of inflammatory-response-related genes in light-damaged retinas. Gene expressions in the retinas in the light damage condition, compared to that of the internal control GAPDH, were normalised to those in the control condition. The expression levels of TLR4 (A), CCL2 (B), C3 (C), CCR2 (D), and GFAP (E) were quantified. Data are represented in terms of the mean ± SE values (saline: n = 8, SIG-1451: n = 8, Tukey’s multiple comparisons test; *, **, *** p < 0.05, 0.01, 0.001, # p < 0.05 compared to the saline group).

