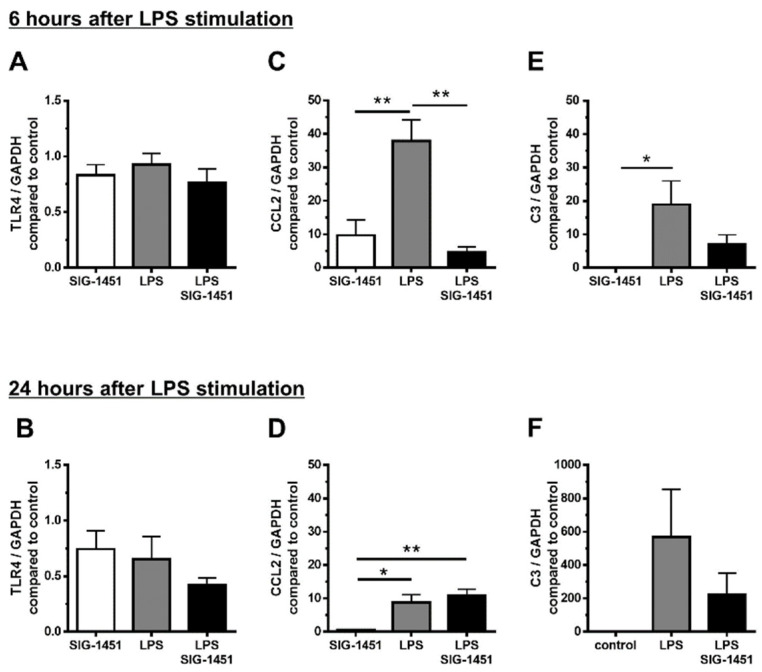
Figure 5.
RT-qPCR analysis of inflammatory-response-related genes in cultured rMC-1 cells. Gene expression in rMC-1 cells was investigated for 6 h (A–C) and 24 h (D–F) after LPS stimulation. Independent experiments were performed. Data are represented in terms of the mean ± SE values (n = 6, Tukey’s multiple comparisons test; *, ** p < 0.05, 0.01).

