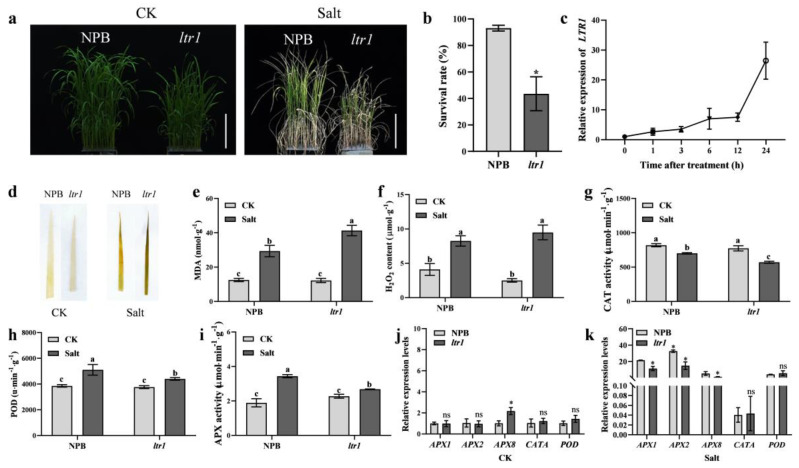
Figure 8.
The response of LTR1 to salt stress in NPB and ltr1. (a) Photos of NPB and ltr1 under CK and Salt treatment, bar = 10.5 cm. (b) The survival rate of NPB and ltr1 after treatment for 7 d. (c) The relative expression level of LTR1 after treatment for 0, 1, 3, 6, 12, 24 h. (d) DAB staining in leaves of NPB and ltr1 under CK and salt treatment. (e,f) MDA and H2O2 content in leaves of NPB and ltr1 under CK and Salt treatment. (g–i) CAT, POD, and APX activity in leaves of NPB and ltr1 under CK and salt treatment. (j,k) The relative expression level of genes related to antioxidant system in leaves of NPB and ltr1 under CK and Salt treatment, n = 4. Data are given as means ± SD. Asterisks indicate significant difference based on the Student’s t-test: * in the figure represents significant difference at p < 0.05 and ns in the figure represents there is no significant difference at p < 0.05. Different lowercase letters indicate significant differences based on the Duncan’s new multiple range test (p < 0.05).

