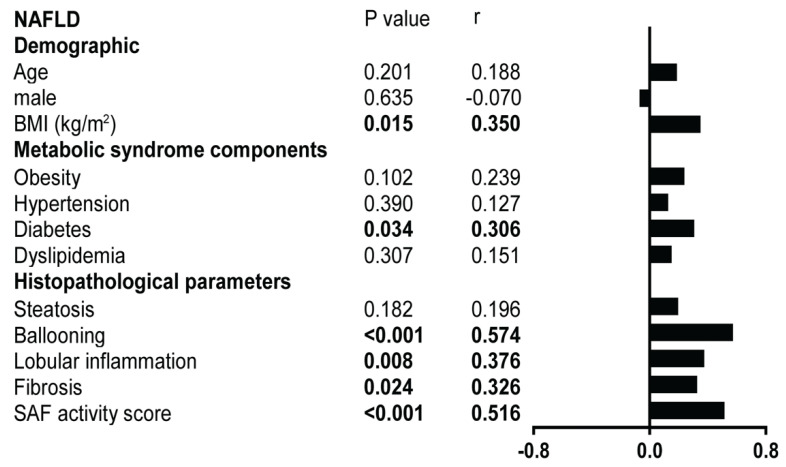
Figure 4.
Correlation with demographic, metabolic syndrome features, and histopathological features in NAFLD (n = 48). The left panel presents Pearson correlation coefficient r and p-values for each variable. The right panel/vertical histogram shows different r levels for each variable with PLA dots/cell. SAF scores were adopted for histological parameters.

