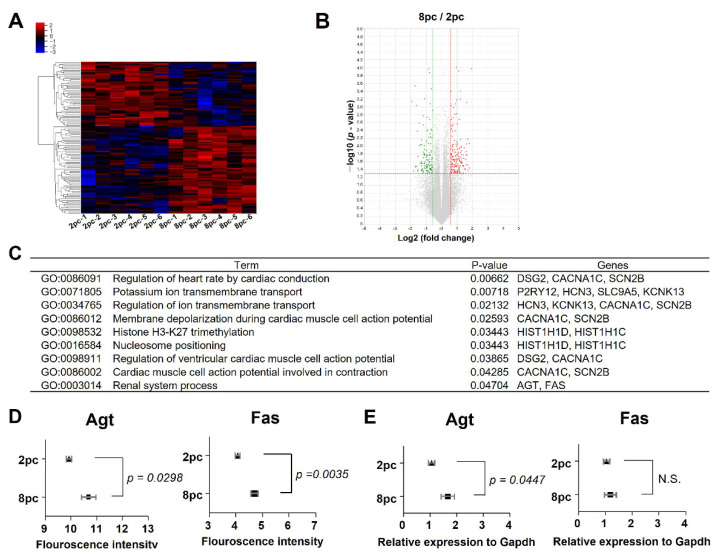
Figure 4.
Hierarchical clustering and analysis of differentially expressed mRNAs. RNA sequencing was performed to compare gene expression in the ovaries of mice (2 or 8 mice per cage) housed for 10 weeks. (A) Hierarchical clustering among the mRNA expression profiles (n = 6 for each group) and (B) volcano plot revealing 116 differentially expressed genes (DEGs) with fold-changes > 1.5 and p < 0.05. Red and green dots indicate up and downregulated differentially expressed mRNAs, respectively. (C) Differentially expressed mRNAs were subsequently classified based on their enrichment in biological processes. (D) Sequencing fluorescence intensities indicate the expression levels of angiotensinogen (Agt) and Fas cell surface death receptor (Fas). (E) Reverse transcription quantitative polymerase chain reaction (RT-qPCR) was performed to verify the differential expression of Agt and Fas. Data are presented as mean ± SEM. Statistical analyses were performed using Student’s t-test. 2pc, mice housed at two mice per cage (triangle); 8pc, mice housed at eight mice per cage (square); N.S., not significant.

