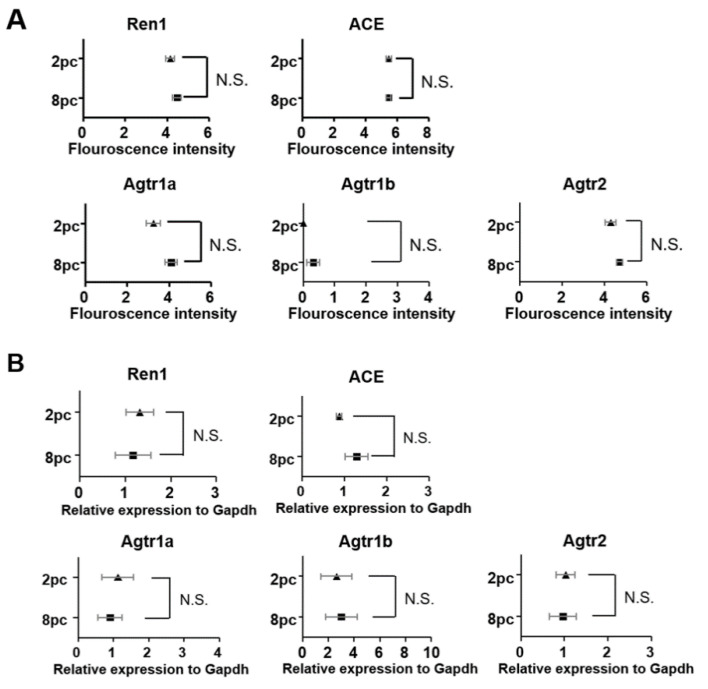
Figure 5.
Expression of genes involved in the ovarian renin-angiotensin system. (A) Sequencing fluorescence intensities indicate the expression levels of Ren1, Ace, Agtr1a, Agtr1b, and Agtr2. (B) RT-qPCR was performed to verify the differential expression of these five genes. Data are presented as mean ± SEM. Statistical analyses were performed using Student’s t-test. 2pc, mice housed at two mice per cage (triangle); 8pc, mice housed at eight mice per cage (square); N.S., not significant.

