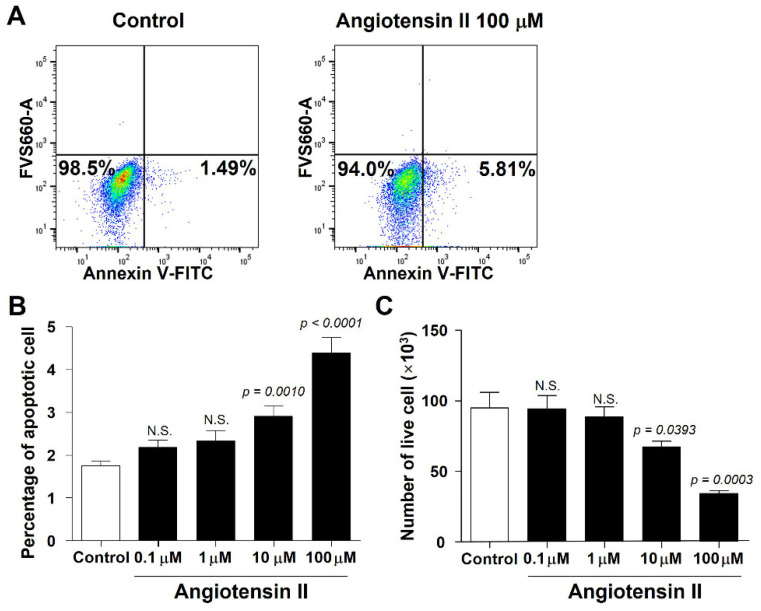
Figure 7.
Viability of a human granulosa cell line after angiotensin II treatment. (A) Flow cytometry was performed to discriminate live cells from dead and apoptotic hGL5 granulosa cells after angiotensin II treatment. (B) Percentage of apoptotic cells (n = 6 for each group). (C) Number of live cells (n = 6 for each group). White and black bars indicate non-treated and angiotensin II-treated group, respectively. Data are presented as mean ± SEM. Statistical analyses were performed using Student’s t-test. N.S., not significant.

