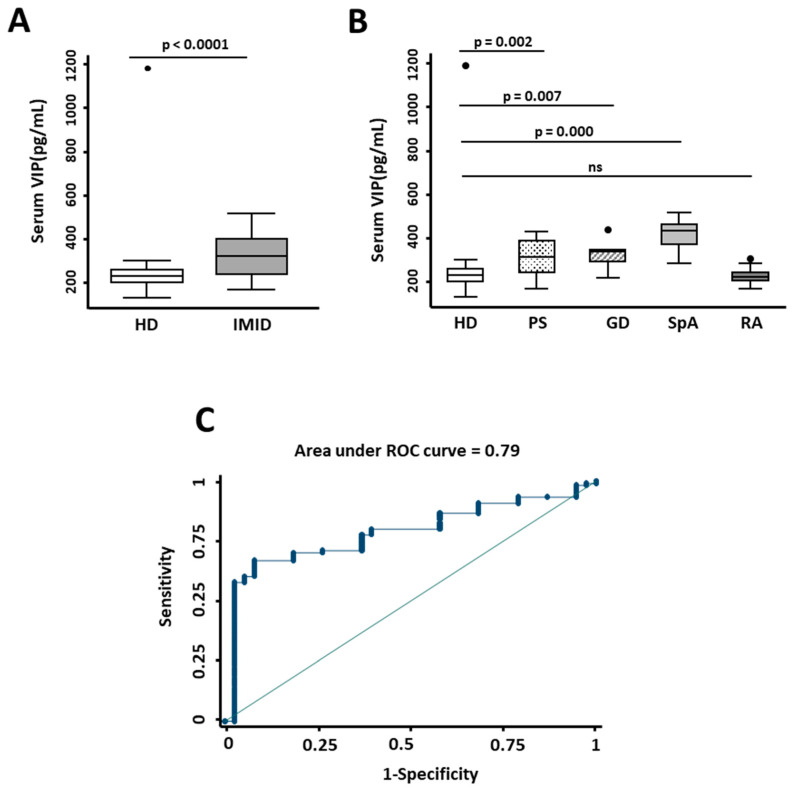
Figure 1.
Expression of serum VIP levels in inflammatory/autoimmune pathologies. (A) Determination of serum VIP levels (pg/mL) by ELISA of 38 healthy donors (HD) and 52 patients with immune-mediated inflammatory diseases (IMID). Statistical significance was determined using the variable of serum VIP levels normalized by inverse square root and Student’s t-test to obtain p-value < 0.0001. (B) Serum VIP levels (pg/mL) of 38 healthy donors (HD) and 15 patients with psoriasis (PS), 8 with Graves’ disease (GD), 15 with spondyloarthritis (SpA), and 14 with rheumatoid arthritis (RA) are shown. Statistical significance was calculated using the variable of serum VIP levels normalized by inverse square root and applying ANOVA and Bonferroni correction for multiple comparisons to obtain p-values as indicated. In all panels, data are presented as the interquartile range (p75: upper edge of the box, p25: bottom edge of the box, and p50: midline) and p90 and p10 (lines below and above the box) of the serum VIP levels. Dots represent outliers. Significance threshold was set at p < 0.05. (C) The graph shows the receiver operating characteristic (ROC) curve analysis to assess the ability of serum VIP levels to discriminate between patients with IMID and healthy donors. Area under ROC curve is indicated in the graph.

