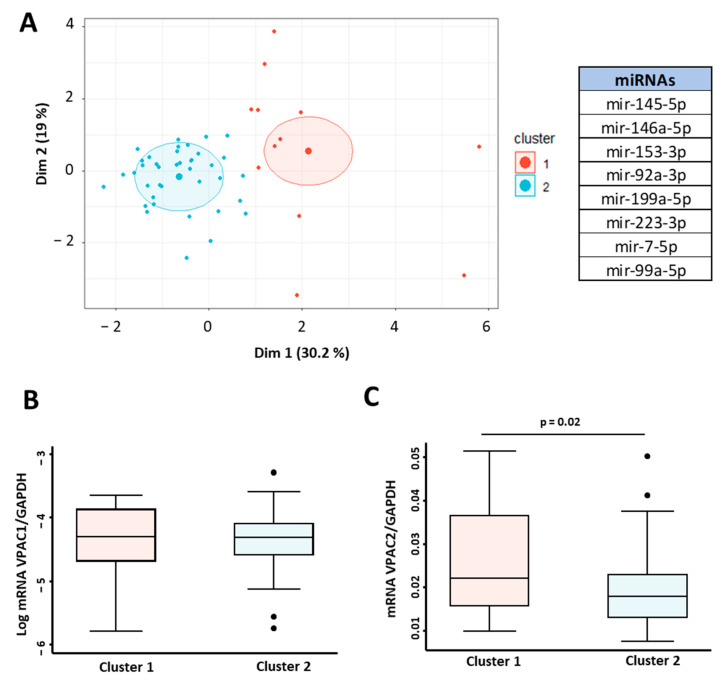
Figure 5.
miRNA signature associated with VPAC receptors gene expression. (A) Cluster analysis in 52 IMID patients based on the expression of miRNAs miR145-5p, miR146A-5p, miR153-3p, miRNA92a-3p, miR199a-5p, miR223-3p, miR7-5p, and miR99a-5p. K-means clustering based on Euclidean distance and PCA was used for graphical representation. Log of relative expression (2−ΔCt) of VPAC1/GAPDH (B) and VPAC2/GAPDH mRNA (C) according to their association with miRNA expression cluster. Statistical significance was calculated using Student’s t-test. For both datasets, data are presented as the interquartile range (p75: upper edge of the box, p25: bottom edge of the box, and p50: midline) and p90 and p10 (lines below and above the box) of the relative gene expression. Dots represent outliers. Significance threshold was set at p < 0.05.

