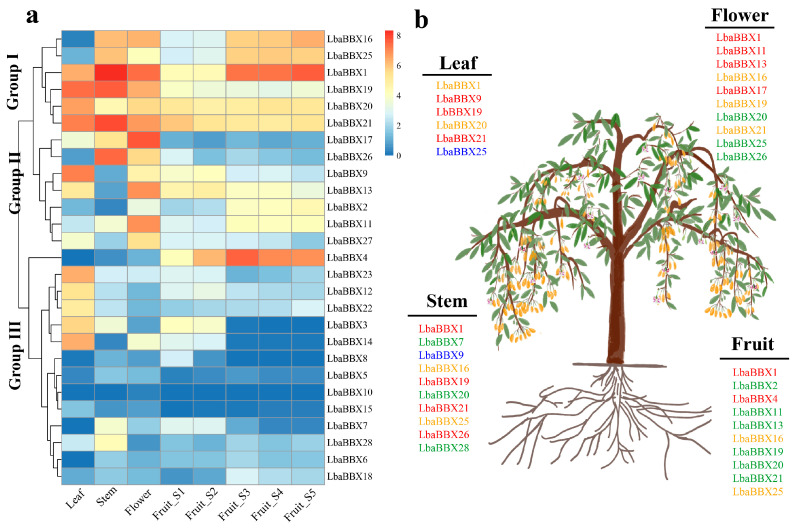
Figure 6.
Expression pattern of LbaBBX genes. (a) Tissue-specific expression pattern of LbaBBX genes in four tissues: leaf, stem, flower, and fruits, including five development stages. Blue and red color indicated lower and higher transcript abundance, respectively. (b) Identification of highly expressed BBX genes in L. barbarum. Blue, green, orange, red indicated low (1–7.3 FPKM), mid-low (7.3–48 FPKM), mid-high (48–114 FPKM), and high (114–317 FPKM) expression, respectively.

