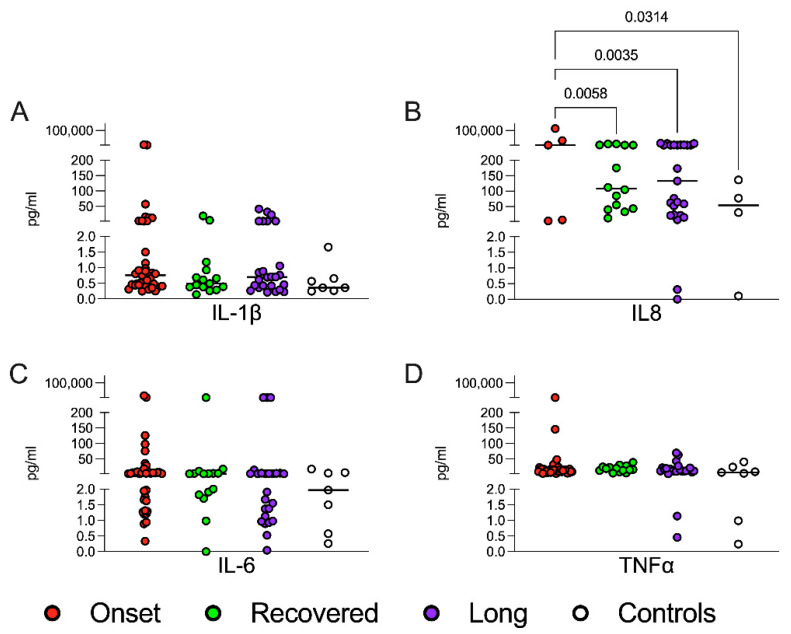
Figure 2.
Cytokine levels in the sera. Cytokine expression was measured in sera samples of patients and healthy subjects at data entry (ELLA Assay, ProteinSimple, San Jose, CA, USA). Each circle represents the concentration (expressed as picograms/milliliter, pg/mL) of the cytokines for each patient/healthy subject, and the 4 plots compare the four groups. Statistical analyses were performed with a two-way ANOVA corrected with Tukey. (A) IL1β: interleukin 1 β; (B) IL8: interleukin 8; (C) IL6: Interleukin 6; (D) TNFα: tumor necrosis factor α. IL8 plot (Figure 2B) displays a limited number of patients/healthy subjects. The missing ones are not shown because they were undetectable.

