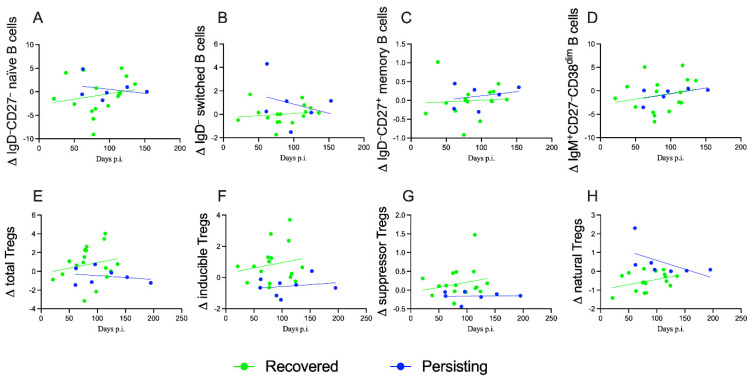
Figure 5.
Modulation of T and B cells subsets during follow up of CoV2-infected children. Each graph shows the deltas of each variable during time (indicated as days post infection/diagnosis); symbols represent the different patients and are displayed with interpolation lines and confidence bands. The panels compare CoV2-infected children who recovered (green circles and lines) with the ones with persistent symptoms (blue circles and lines). (A–D) display B cells subsets: naïve (F = 0.5453. DFn = 1, DFd = 18 and p = 0.4698), switched (F = 1.150. DFn = 1, DFd = 18 and p = 0.2977), memory (F = 0.04023. DFn = 1, DFd = 18 and p = 0.8433) and pre-transitional (F = 0.000019. DFn = 1, DFd = 18 and p = 0.9965) B lymphocytes, respectively. (E–H) show regulatory T cell subpopulations: total (F = 0.6585. DFn = 1, DFd = 20 and p = 0.4266), inducible (F = 0.1222. DFn = 1, DFd = 20 and p = 0.7303), suppressor (F = 0.3908. DFn = 1, DFd = 20 and p = 0.5389) and natural (F = 5.761. DFn = 1, DFd = 20 and p = 0.0262) Tregs, respectively. Simple linear regression revealed significant differences of the slopes only for natural Tregs (H).

