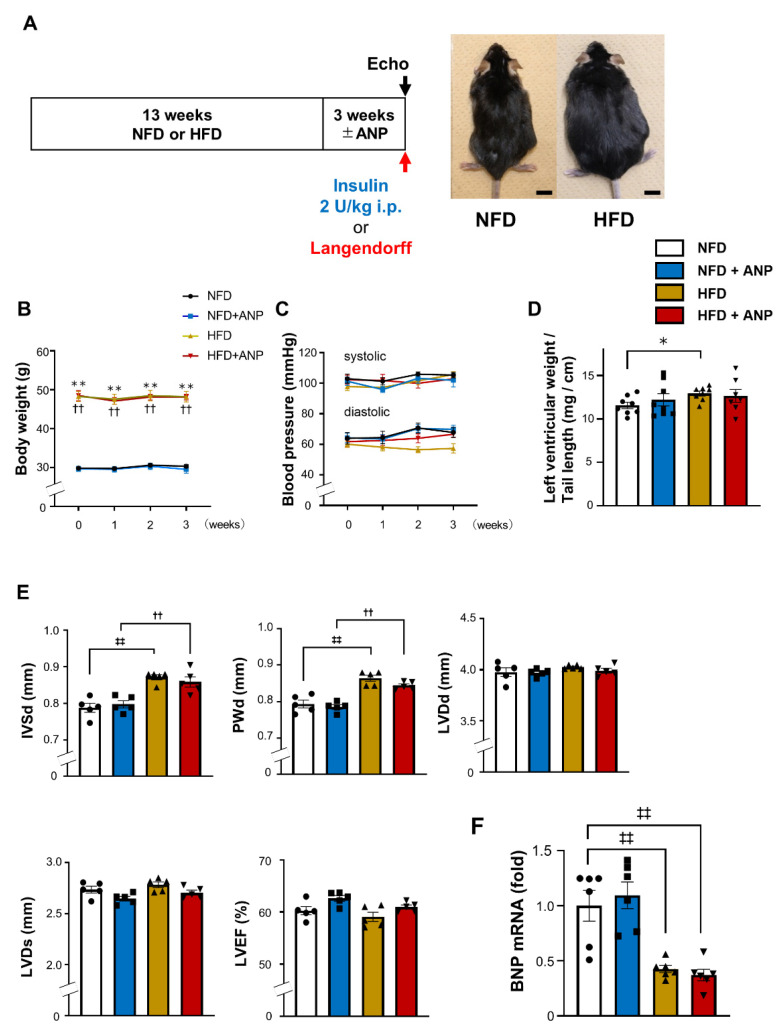
Figure 1.
Characteristics of HFD model after treatment with or without ANP. (A) A schematic diagram of the experimental protocol and appearance of the obese mice after 13 weeks of HFD feeding. Bars = 1 cm. (B) Body weight changes during ANP treatment (n = 6 each). (C) Blood pressure changes during ANP treatment (n = 4 each). (D) Heart weight at three weeks after treatment with or without ANP (n = 8 each, except for HFD+ANP (n = 7)). (E) Echocardiographic parameters at three weeks after treatment with or without ANP (n = 5 each). (F) The relative mRNA expression of BNP in left ventricle at three weeks after treatment with or without ANP (n = 6 each). The qPCR data were normalized to glyceraldehyde-3-phosphate dehydrogenase (GAPDH). The data are shown as the fold change normalized to the levels found in the NFD group. * p < 0.05 and ** p < 0.01 versus NFD, ‡‡ p < 0.01 versus NFD, †† p < 0.01 versus NFD + ANP. HFD, high-fat diet; IVSd, end-diastolic thickness of intraventricular septum; LVDd, left ventricular end-diastolic dimension; LVDs, left ventricular end-systolic dimension; LVEF, left ventricular ejection fraction; NFD, normal-fat diet; PWd, end-diastolic thickness of posterior wall.

