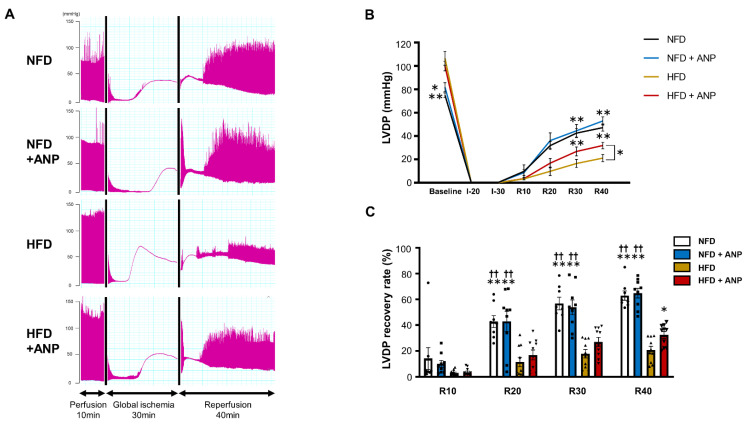
Figure 3.
Cardiac functional recovery after IRI with or without ANP treatment. (A) Representative tracing of LVDP during ischemia–reperfusion with or without ANP treatment. LVDP profiles (B) and LVDP recovery (percent of baseline) (C) measured at the indicated time points during ischemia–reperfusion in NFD (n = 8), NFD+ANP (n = 9), HFD (n = 10), and HFD+ANP (n = 10) hearts are shown. * p < 0.05 and ** p < 0.01 versus HFD, †† p < 0.01 versus HFD + ANP. I, ischemia; LVDP, left ventricular-developed pressure; R, reperfusion.

