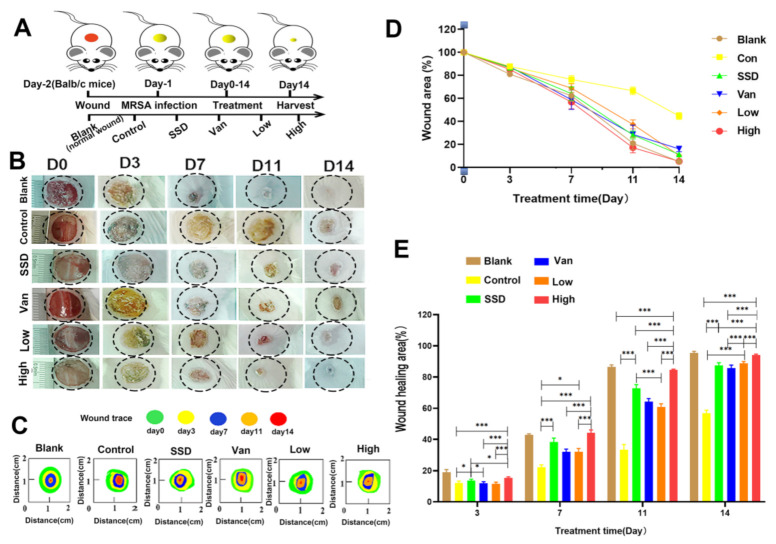
Figure 2.
In vivo effects of the composite membranes on wound healing. (A) Schematic illustration of the construction and treatment process of wound infection. (B)The representative images of the wound healing process of mice treated with blank, control, PD (Low, High), SSD, and Van hydrogels. (C)Traces of wound-bed closure during 14 days for each treatment. (D) In vivo wound closure rates for six groups at different time points. (E) Quantitation of the topical wound healing rate. The data are expressed as mean ± standard deviation and analyzed using a one-way ANOVA followed by the LSD test for multiple comparisons (* p < 0.05, *** p < 0.001, n = 6).

