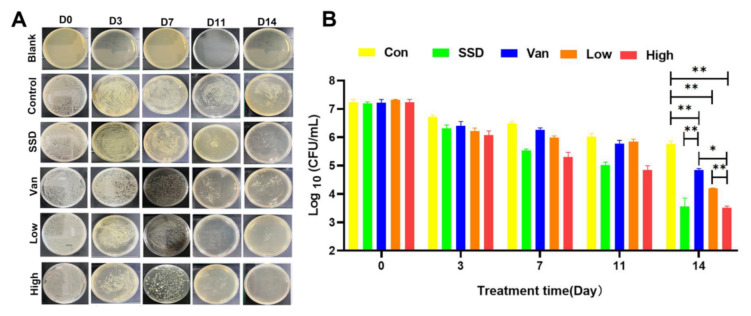
Figure 3.
(A) The photographs of bacterial colonies spread on agar plates from the infected skin tissues with different treatments. Representative images of bacterial growth on agar plates after 24 h of incubation. (B) Corresponding statistical analysis of the viable MRSA. Bacterial load (log CFU/mL) in various formulation-treated groups as compared to untreated control. The data are expressed as mean ± standard deviation and analyzed using a one-way ANOVA followed by the LSD multiple comparison tests (* p < 0.05, ** p < 0.01, n = 3).

