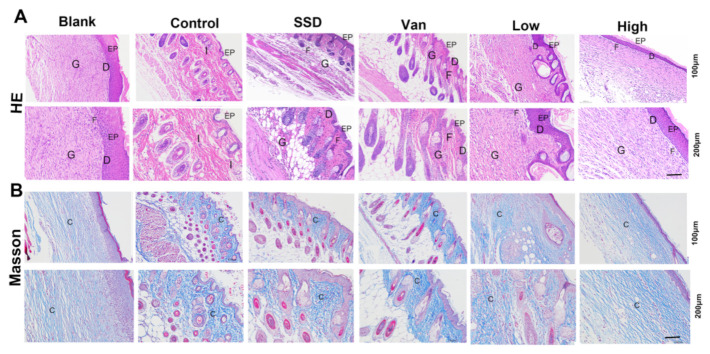
Figure 4.
(A) Typical H&E staining micrographs of the wounds treated by different treatments on day 14. (B) Representative images of Masson trichrome-stained tissue sections of wounds treated with PD (1%, 2.5%), SSD, and Van wounds on day 14. Notice the dense collagen deposition in the PD, SSD, and Van nanofibrous dressings compared to the untreated wound control (magnifications, ×100 and ×200). EP: epidermis; D: dermis; G; granulation tissue; I: inflammatory cells; F: fibroblasts; C: collagen.

